This guide walks you through building a complete end-to-end analytics solution using Microsoft Fabric and Power BI. You will create a semantic model, define relationships, load and transform data using Dataflow Gen2, build measures, and validate your model with reports. Finally, you will connect Power BI Desktop, publish content to Fabric, and distribute reports through Apps for end users.

Part 2
*
This guide is designed to be followed in sequence:
Part 1 - Fabric Data Engineering & Analytics Pipeline
Part 2 - Fabric Data Modeling & Report Deployment Guide
*
All files used in this project are located here
*
Task Details
1. Create semantic model.
2. Create relationship between tables.
3. Create a simple report to validate the relationships.
4. Add the sensor_data.json file to the semantic model.
5. Use Dataflow Gen2 to load data from a view and store it as a Delta table in a Lakehouse.
6. Create measure.
7. Connect Power BI Desktop to the Fabric semantic model.
8. Create a visual in Power BI Desktop and publish it to Fabric.
9. Connect the SQL endpoint to Power BI Desktop.
10. Create a report automatically.
11. Share your report with users through Apps.
*
Steps
Create semantic model.
In Microsoft Fabric, a semantic model is a crucial layer that sits on top of your data stored in a Lakehouse or Warehouse. It defines how tables relate to each other and how data is structured for reporting. By creating a semantic model, you can establish relationships between tables, build measures, and prepare your data for accurate and efficient analysis in Power BI.
Note: You can create a semantic model from a lakehouse and from an SQL analytics endpoint.
Lakehouse vs SQL Analytics Endpoint (Semantic Model)
- Lakehouse connection reads directly from Delta tables in OneLake and supports DirectLake mode for high-performance, large-scale analytics. It is best when data is already clean and does not require complex transformations.
- SQL Analytics Endpoint connection uses a relational SQL layer (T-SQL), allowing views, joins, and schema design, making it more suitable for structured reporting and building a star schema.
Key difference:
- Lakehouse = raw, high-performance data access
- SQL Endpoint = structured, SQL-modeled data for reporting
*
1. Upload products.csv and convert it into a Delta table.
In the Lakehouse, expand Files, click the … (More options) menu, select Upload, and upload the file.

*

*
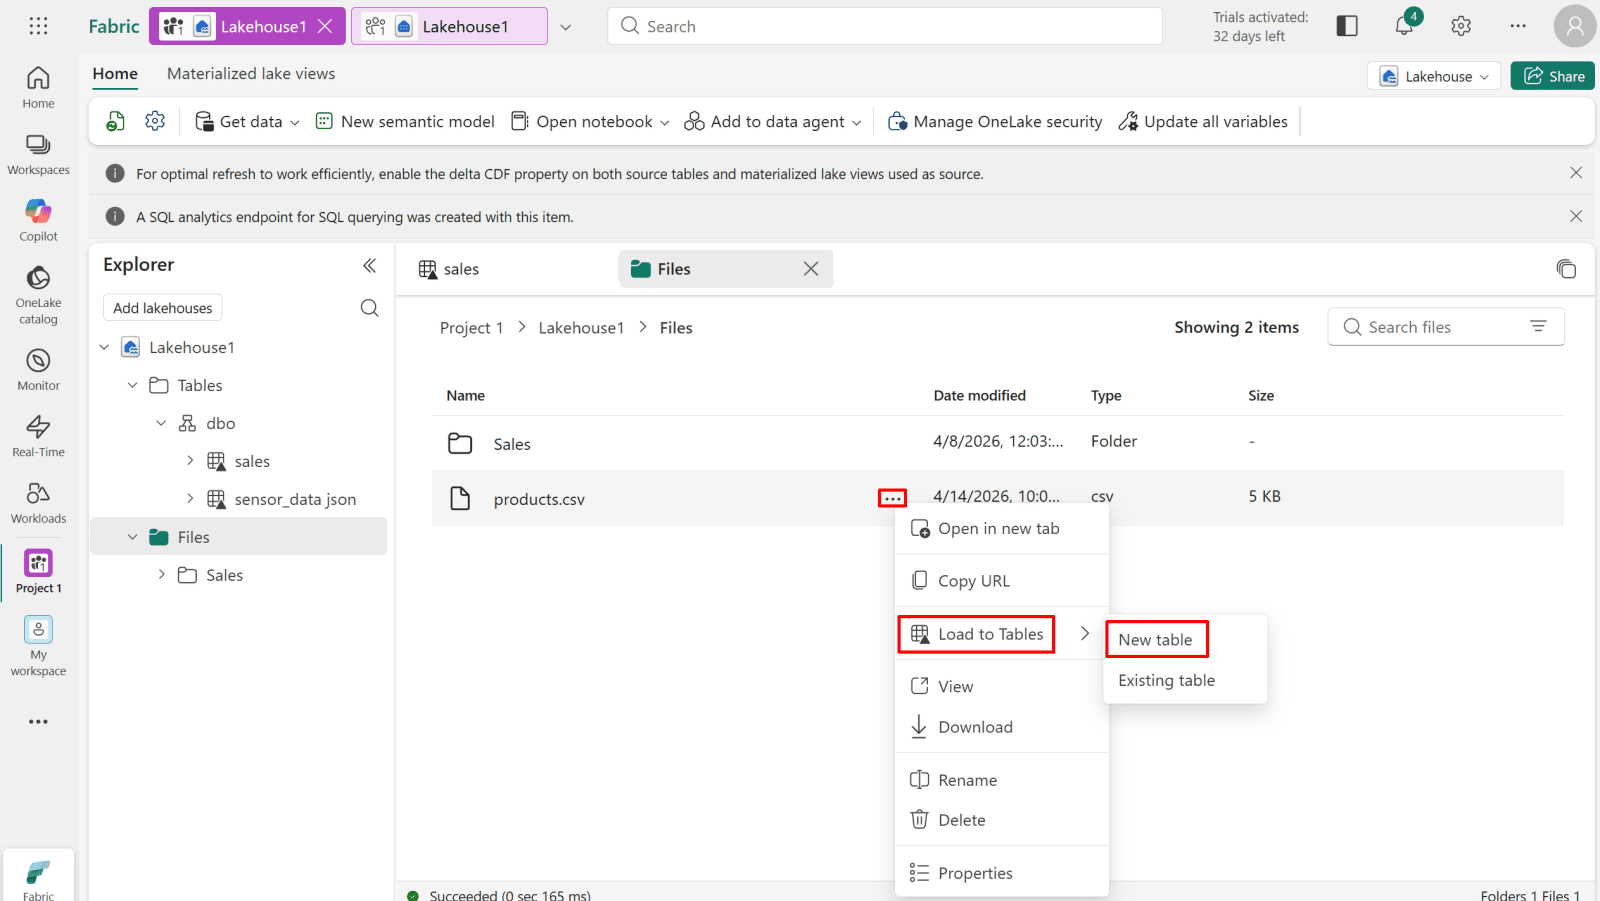
2. Expand the options for products.csv and load data into a new table.
Click the … (More options) next to products.csv, then select Load to new table.
*

*
3. From your Lakehouse, switch to the SQL Analytics Endpoint.
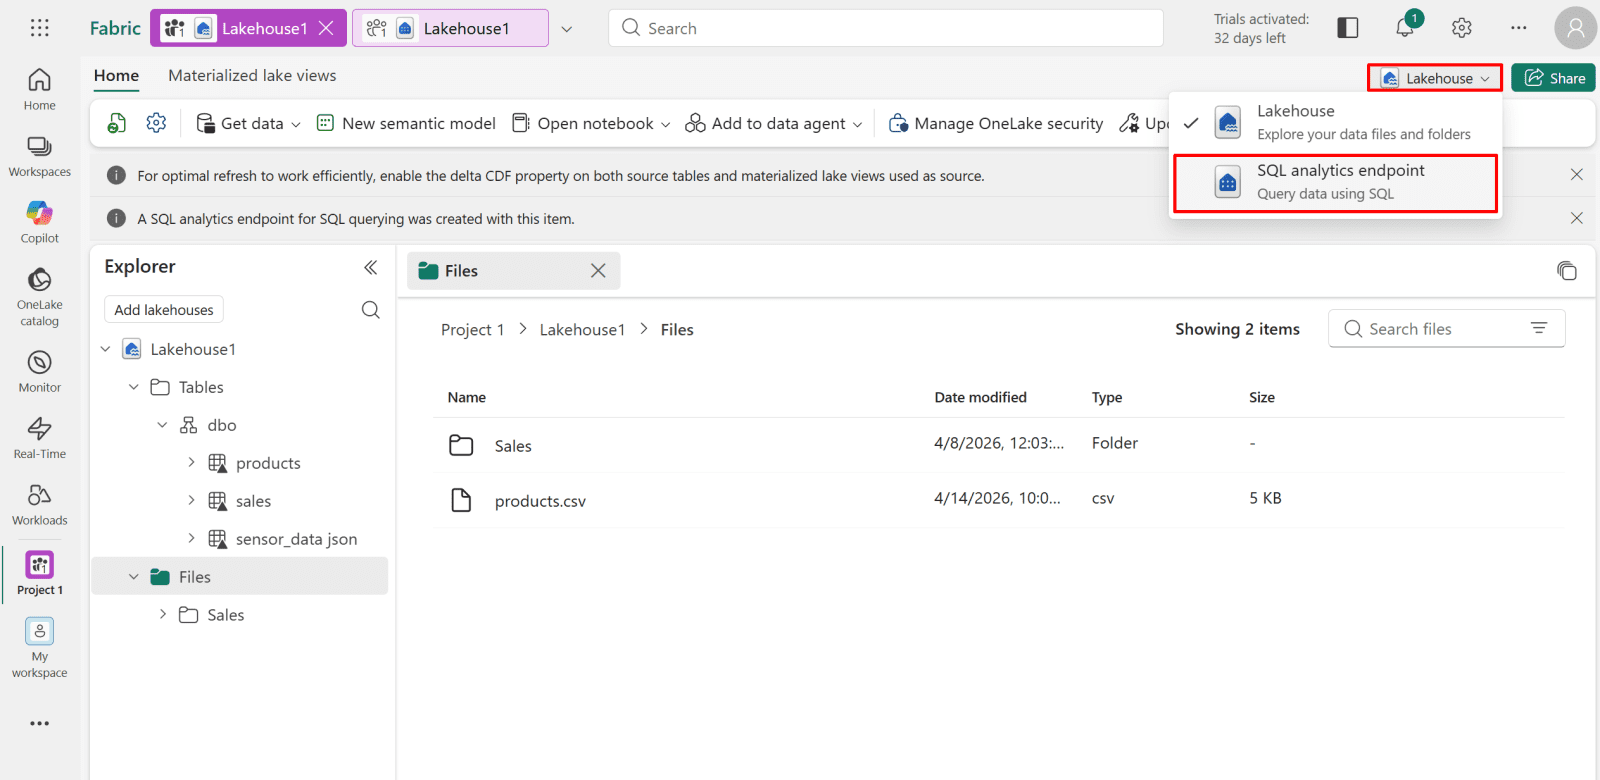
*
4. Create semantic model from SQL analytics endpoint.
Note: You can create semantic model from lakehouse and from SQL analytics endpoint.
Lakehouse vs SQL Analytics Endpoint (Semantic Model)
- Lakehouse connection reads directly from Delta tables in OneLake and supports DirectLake mode for high-performance, large-scale analytics. It is best when data is already clean and does not require complex transformations.
- SQL Analytics Endpoint connection uses a relational SQL layer (T-SQL), allowing views, joins, and schema design, making it more suitable for structured reporting and building a star schema.
Key difference:
- Lakehouse = raw, high-performance data access.
- SQL Endpoint = structured, SQL-modeled data for reporting.

*
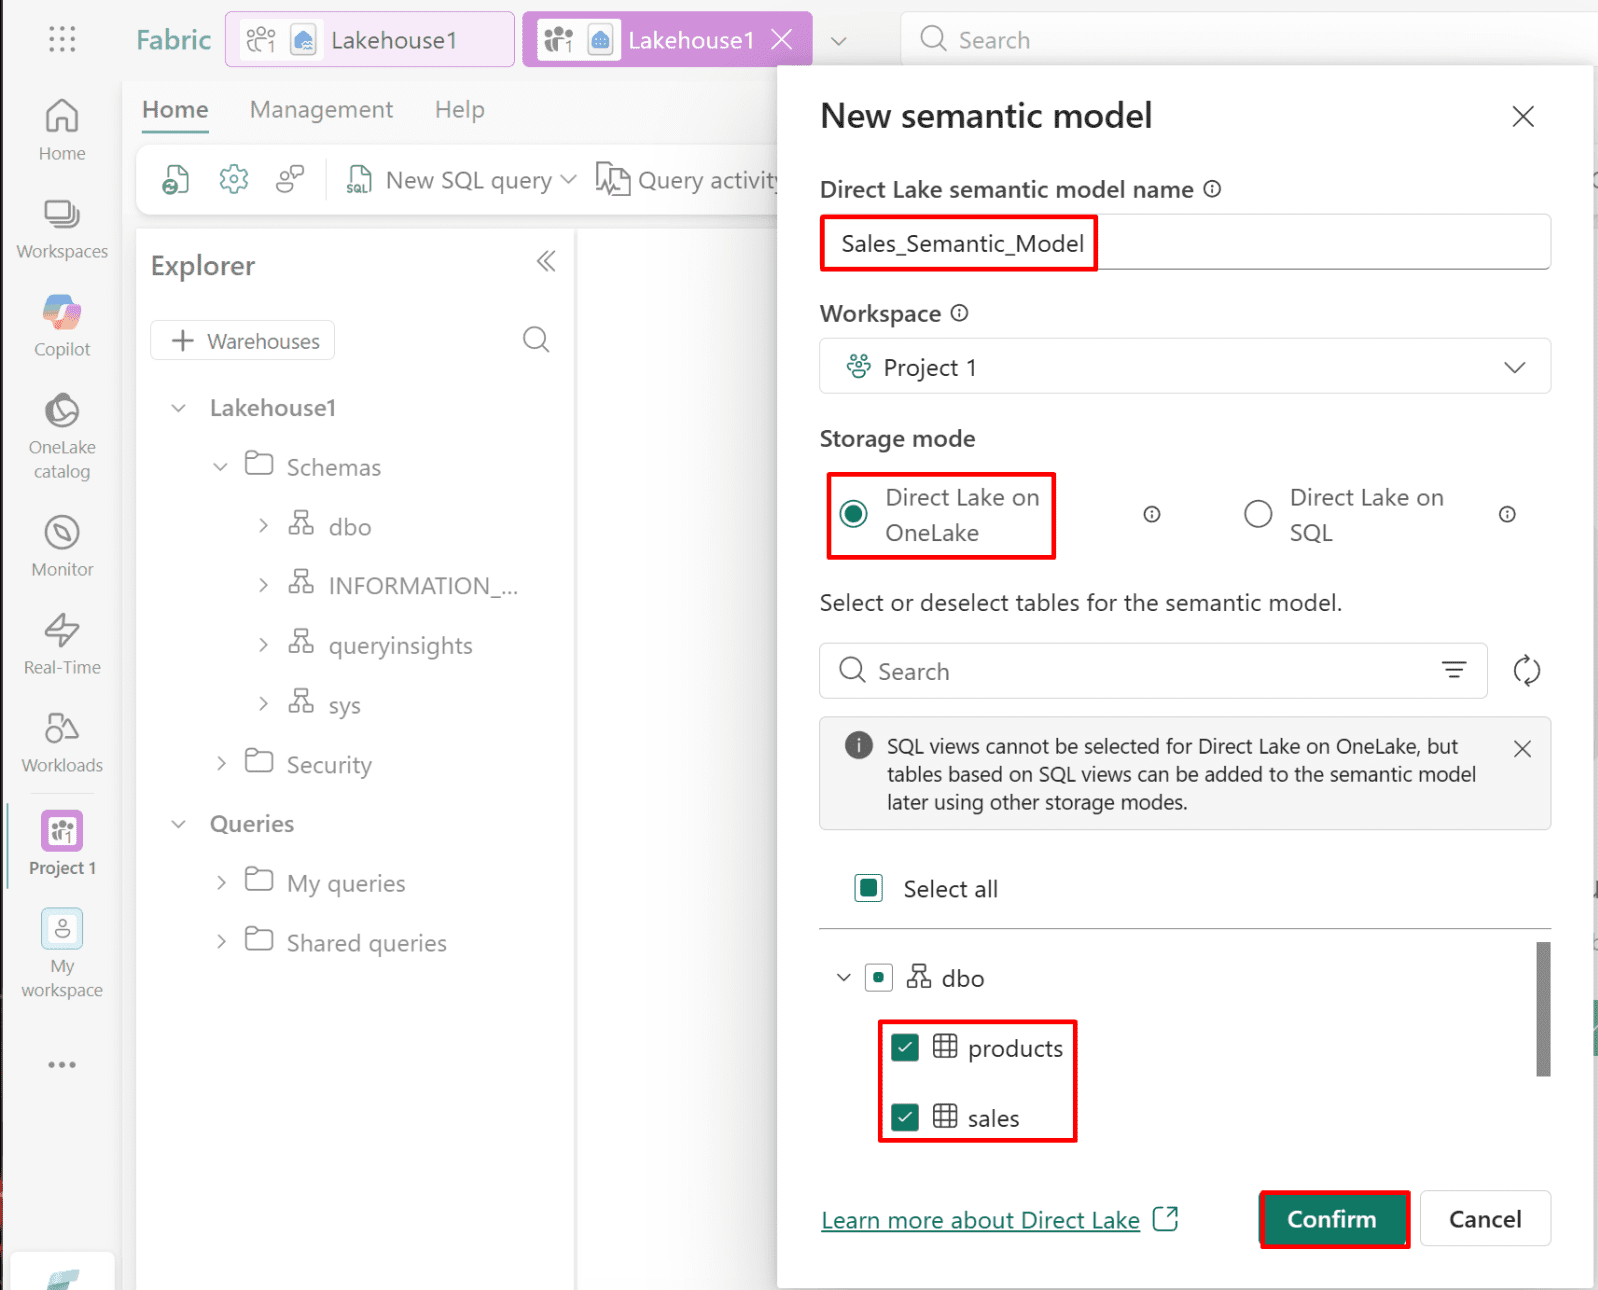
5. Provide a name for the semantic model and select the tables to include in the model.
When to Select Each Storage Model (Fabric Semantic Model)
- Direct Lake (OneLake)
Select when you need maximum performance on large datasets, data is already stored as Delta tables in OneLake, and you want no data copy or import with near real-time analytics. - Direct Lake (DirectQuery) (SQL Analytics Endpoint)
Select when you need SQL-based modeling, such as views, joins, and transformations, or when working with complex relational structures (star schema) that require controlled querying.
*
6. Once complete, you will be redirected to the semantic model.

*
Create a relationship between tables.
In this step, you will define relationships between tables in the semantic model to ensure data is properly connected. This allows Power BI to understand how tables relate to each other, enabling accurate filtering, aggregation, and reporting across the dataset.
1. Create a one-to-many relationship from products to sales. (One product can have many sales.)
- Drag and drop the Product_ID column from the Products table onto the corresponding Product_ID column in the Sales table.

*
2. Ensure the relationship is set to one-to-many (One product can have many sales) from Products to Sales, then click Save.
Note: Fabric saves changes automatically.

*

*
Create a simple report to validate the relationships.
1. From your workspace or semantic model, create a report.
From the semantic model.
- Click File then click Create new report.

*
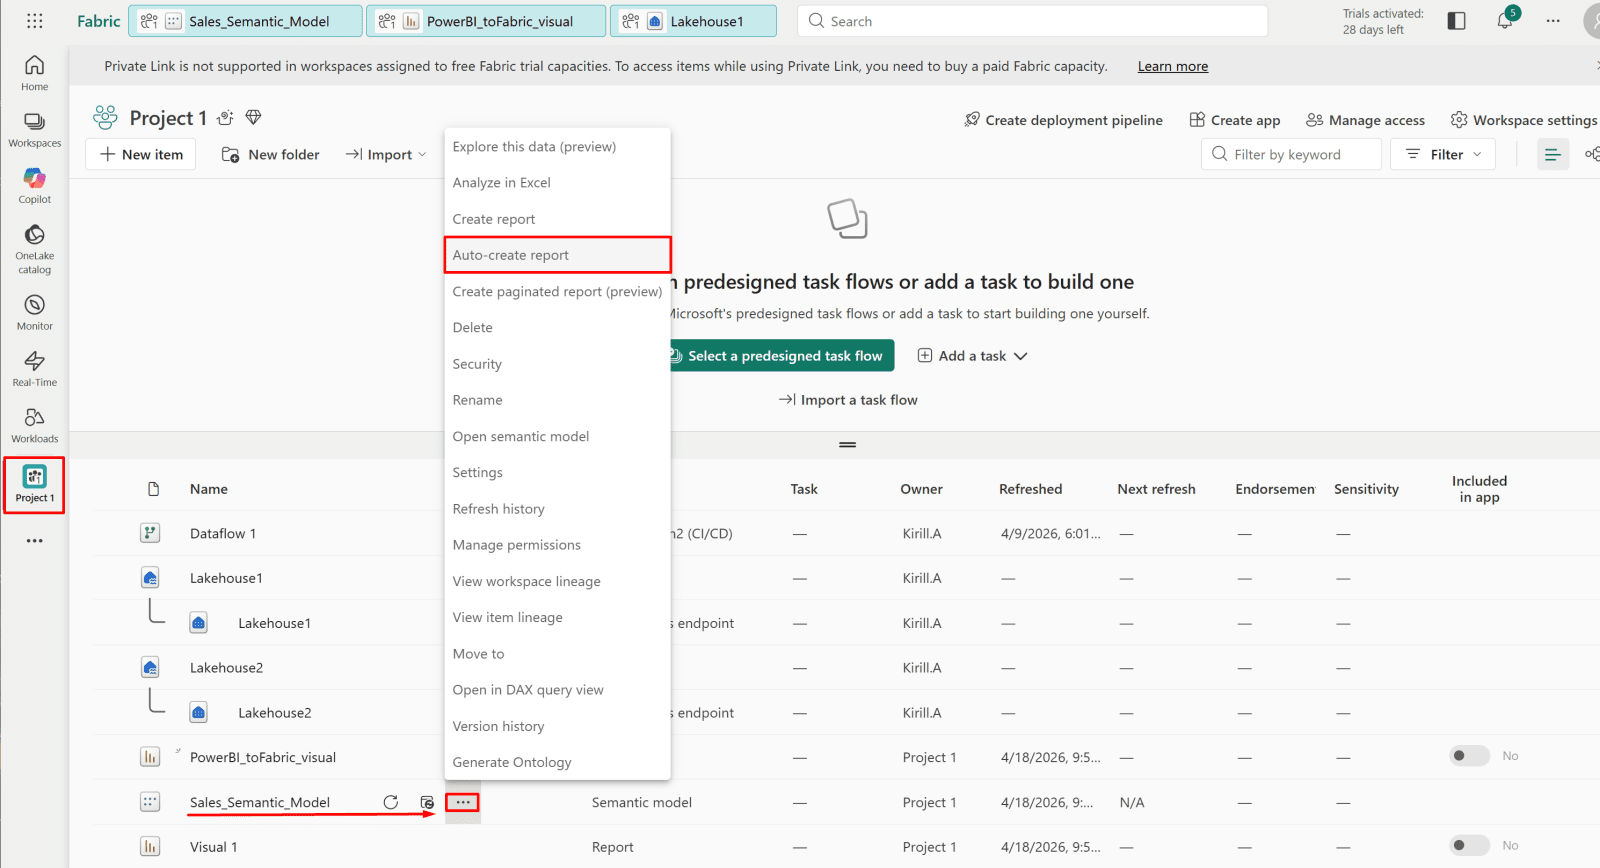
From workspace.
- Click the … (More options) next to semantic model, and then select Create report.

*
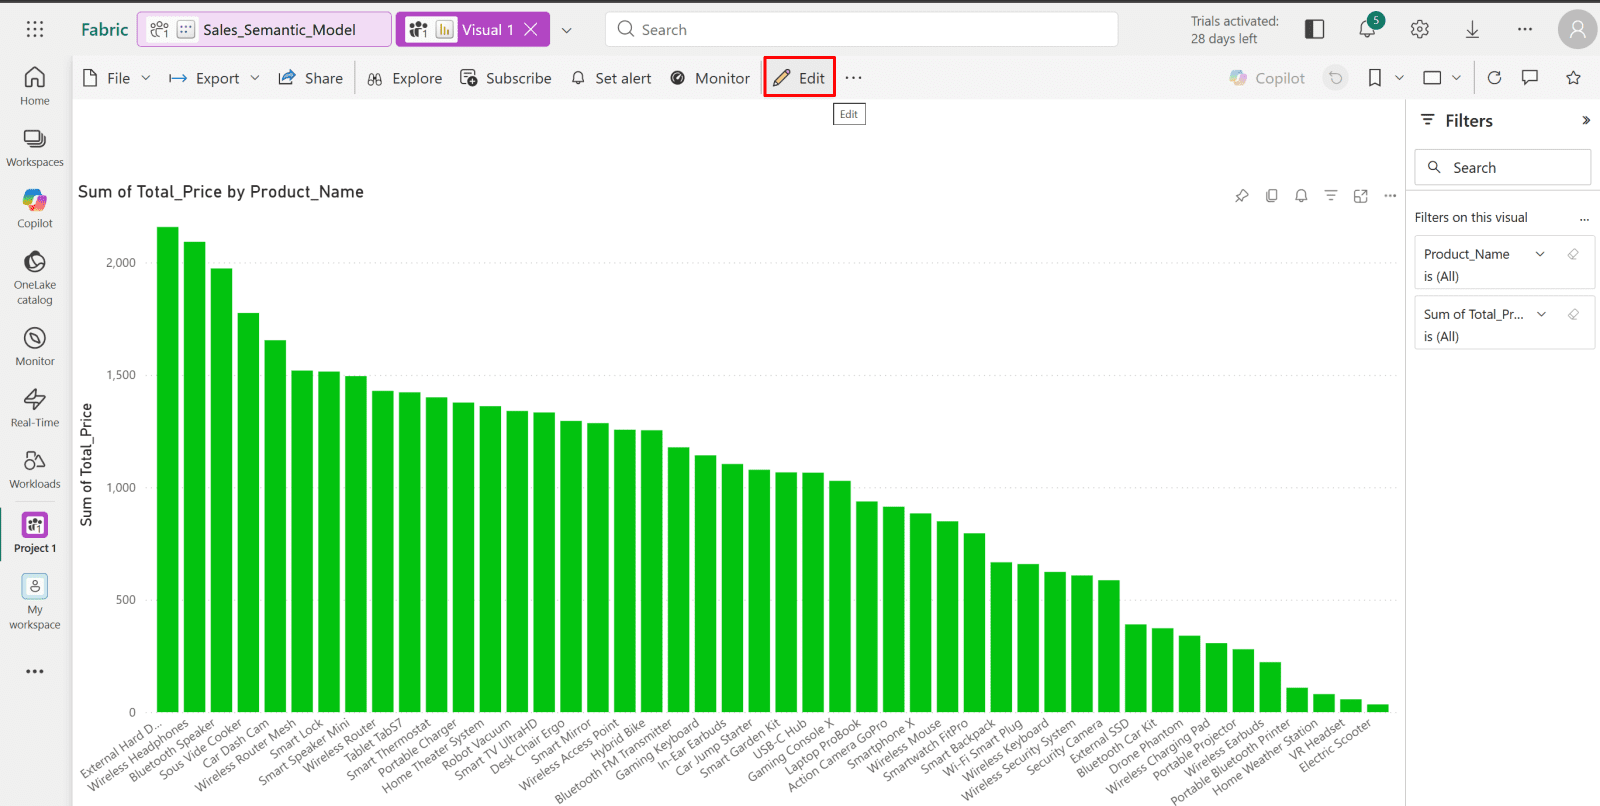
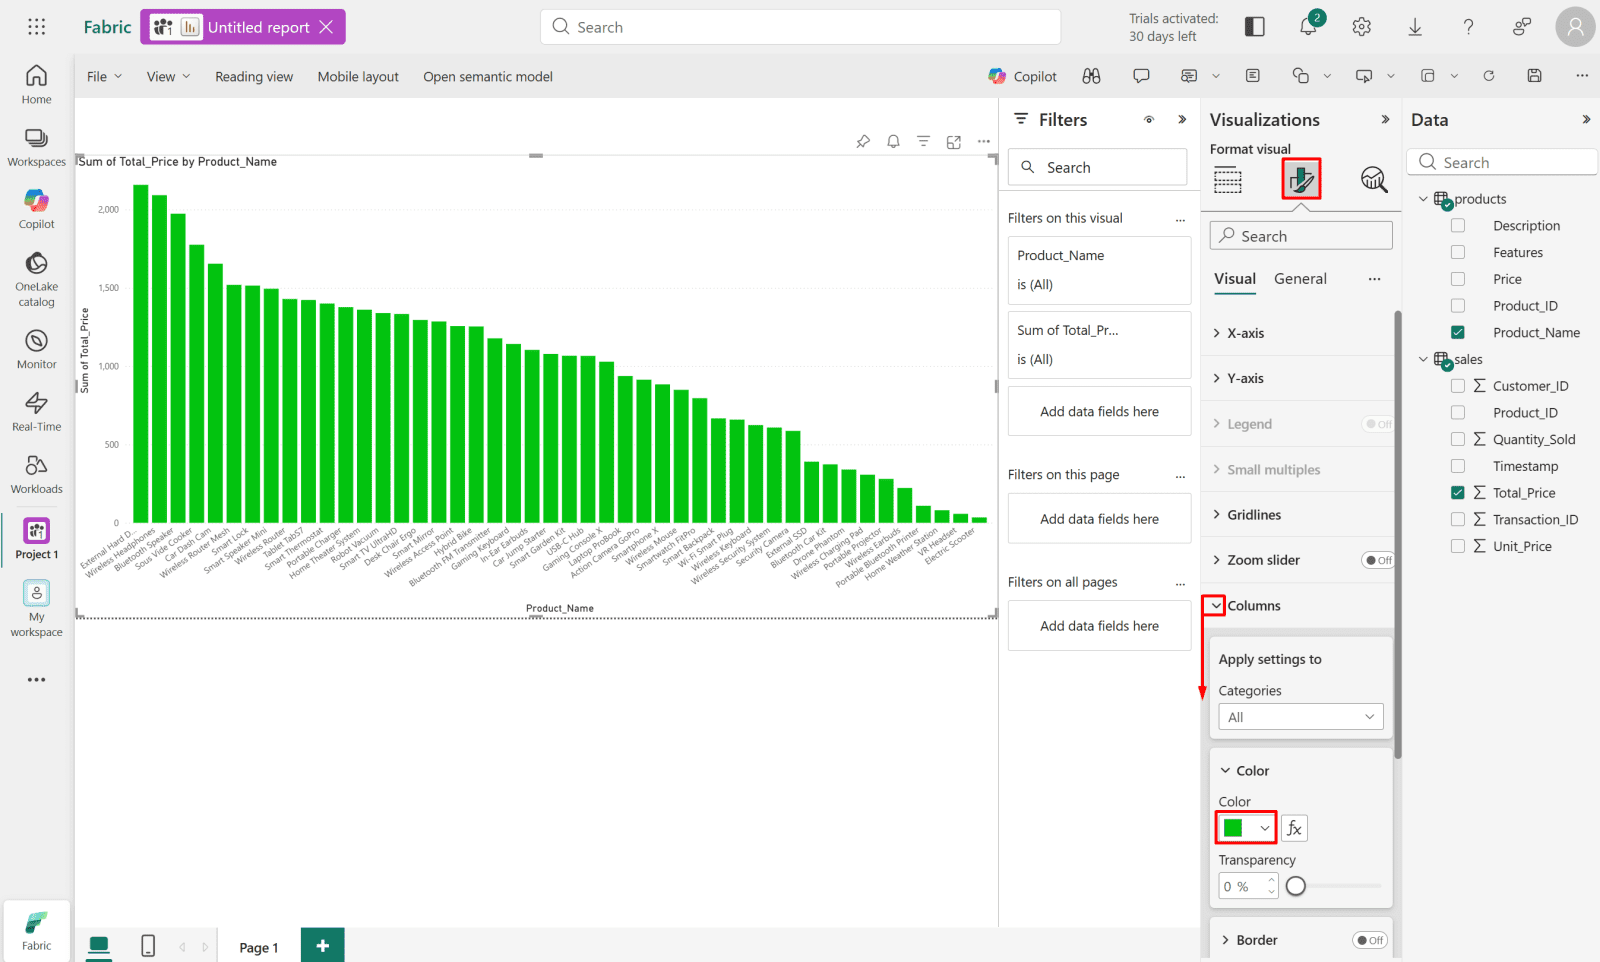
2. Test the relationships.
- Select stacked column chart
- Drag and drop Product_Name column from products table to the X-axis
- Drag and drop Total_Price column from sales table to the X-axis
As we can see, the relationship is working correctly, since we are able to use data from two related tables within a single visual.

*
3. Change column color.
Switch to the “Format your visual” tab and change the columns color.
*
4. After saving your report, it will appear in your workspace.