Loading...

Azure Quick Links

Part 4

Power BI Report Deployment & Management

This guide walks you through the key steps to publish, secure, and share your Power BI reports effectively. From signing in and publishing your reports to configuring dashboards, RLS, and dataset access, these instructions ensure that your team can collaborate securely and gain insights from your data efficiently. The guide also covers connecting on-premises (Server 2025) CSV data to Power BI using a standard mode data gateway, so you can refresh and analyze local data seamlessly. Whether you are creating dashboards for desktop or mobile, this guide covers best practices for managing access, automating alerts, and leveraging Power BI’s analytical features..

*

This guide is designed to be followed in sequence:

Part 1 - Advanced Data Preparation in Power BI

Part 2 - Model the Data with power BI

Part 3 - Visualization and Report Creation with Power BI

Part 4 - Power BI Report Deployment & Management

*

Important: To follow this guide, you will need a Power BI Pro or Premium license.

The complete report can be found here

*

Task Details

1. Sign in to Power BI Service.

2. Publish the report to Power BI Service, then export the data to Excel or CSV.

3. Set the sensitivity label.

4. Create a workspace and assign roles to users.

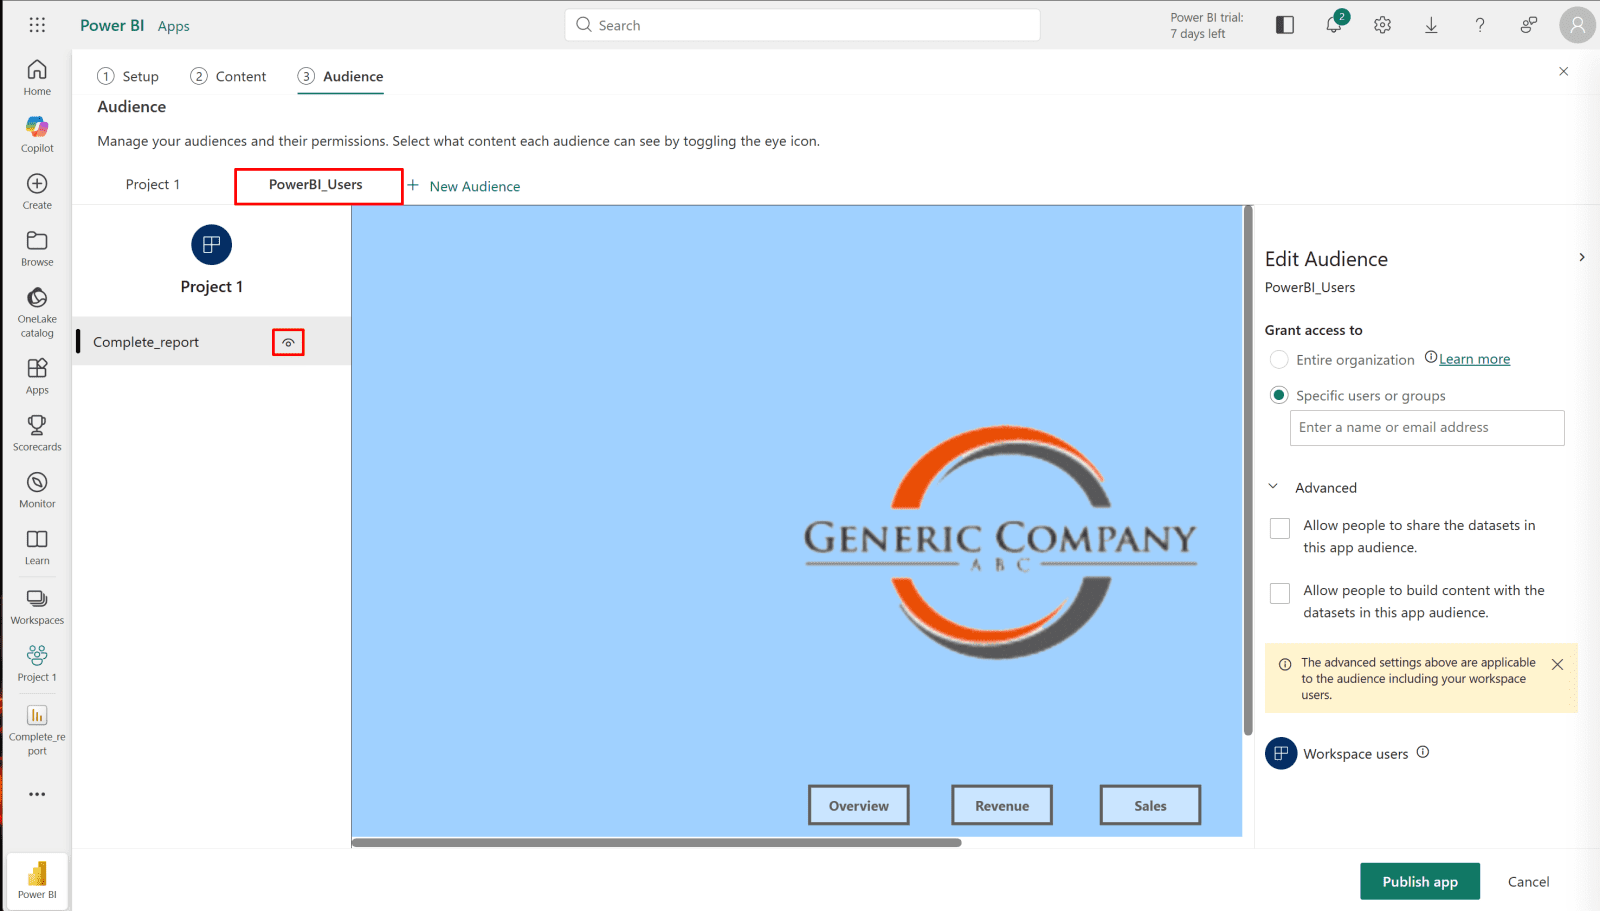
5. Create a workspace app and set the audience.

6. Update the reports and dashboards in your workspace.

7. Pin visuals and live pages to the dashboard.

8. Add and configure the Q&A feature on your dashboard and set the dashboard theme.

9. Configure the mobile layout.

10. Get Insights: Automatic Data Analysis.

11. Connecting On-Premises CSV Data to Power BI Using a Data Gateway in Standard Mode.

12. Set up subscription and data alerts.

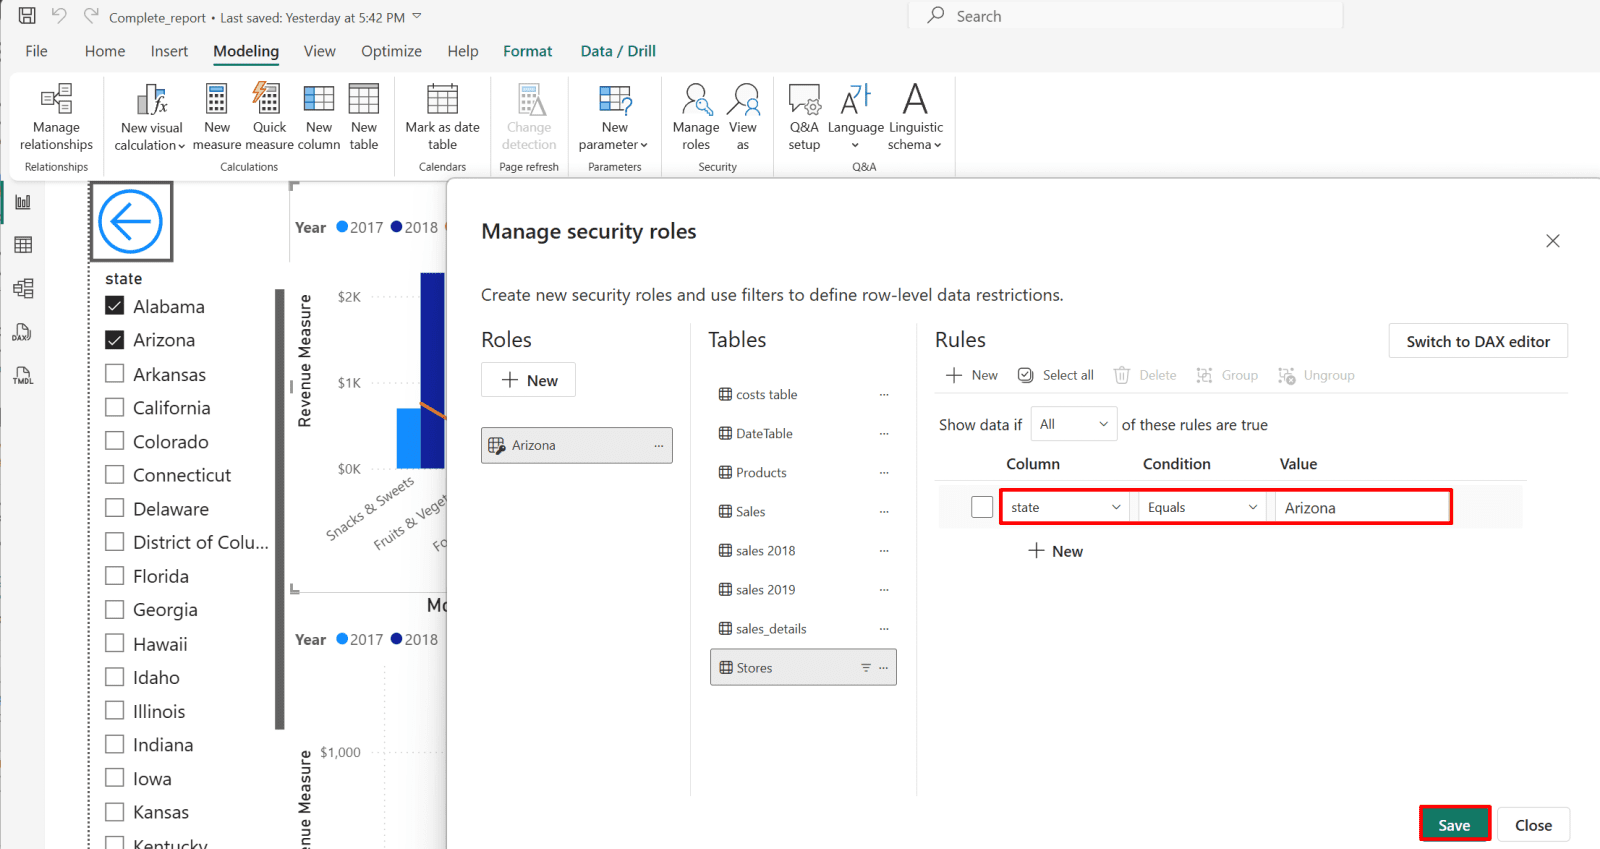
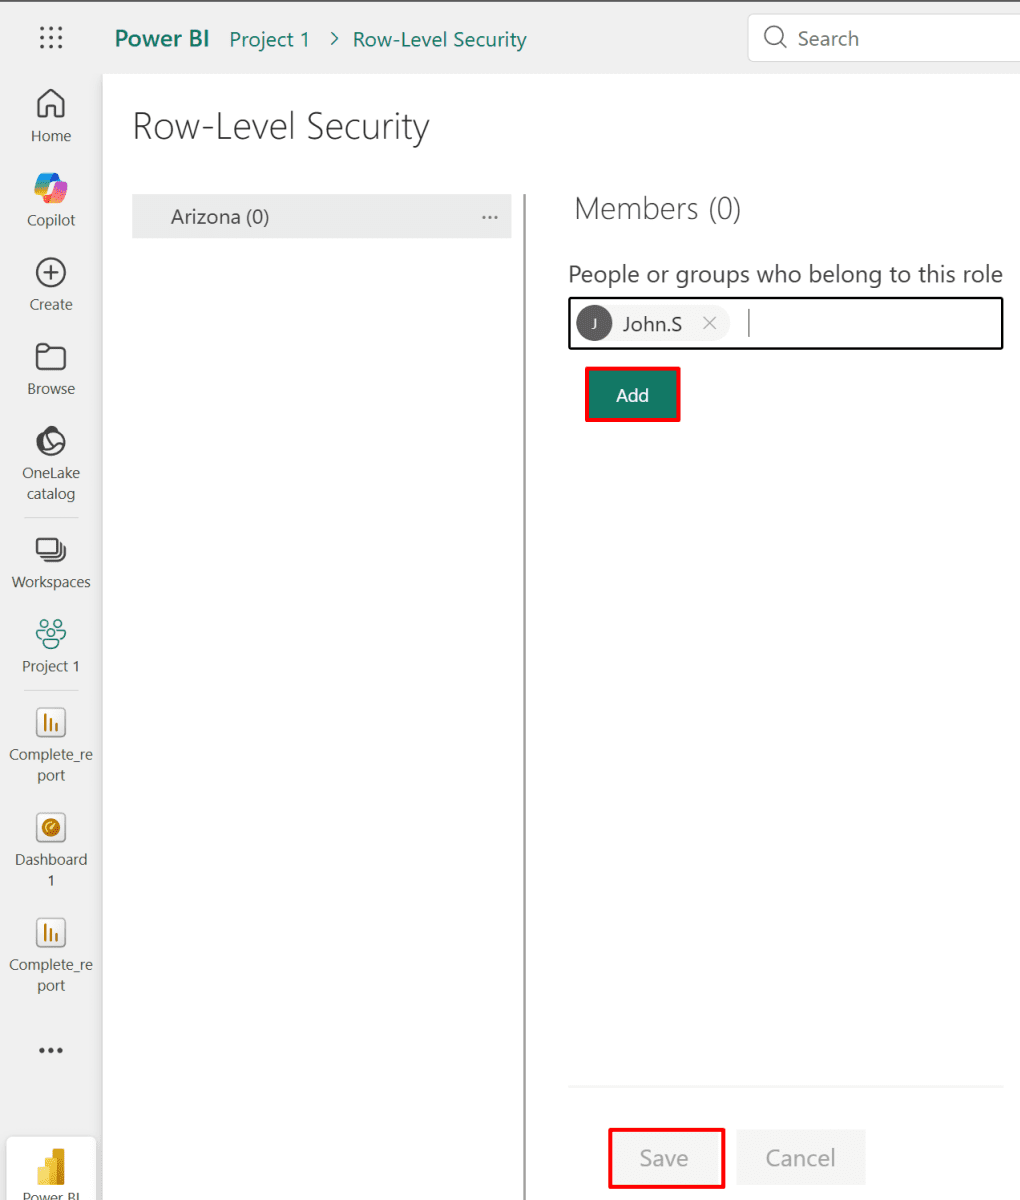
13. Create RLS roles and assign group members in Power BI Desktop.

14. Grant users or groups access to the dataset.

*

Steps

*

Sign up with the Power BI service.

Any Microsoft Entra ID account (formerly Azure AD account) that exists in a Microsoft 365 tenant can access the Power BI Service, as long as:

  • The account has a work or school account type.
  • The account is assigned a Power BI license (Pro or Premium per user).

Here’s how it works:

  • Entra ID account → identifies the user in your tenant.
  • License assignment → tells Power BI what features the user can access.
  • Power BI Service → allows the account to log in, access workspaces, refresh datasets, and create reports.

Note: You can activate a free 60-day Power BI Pro trial to test all features, including report creation, sharing, and workspace collaboration, before purchasing a license.

Note: You must use a work or school account to create and use a Power BI service account. Personal email accounts (such as Gmail or Outlook.com) are not supported in Microsoft Power BI Service. The account must be created within your organization’s tenant in Microsoft Entra ID (formerly Azure Active Directory) and assigned an appropriate Power BI license.

Note: Although a Microsoft Power BI Service sign-in is possible using a Global Administrator account, it is not recommended to use Global Admin accounts for Power BI automation or service tasks. Instead, create a dedicated work or school service account in Microsoft Entra ID and assign only the required Power BI license and workspace permissions. This follows the principle of least privilege and improves security.

*

Publish the report to Power BI Service, then export the data to Excel or CSV.

Publishing a report and its data to Power BI Service allows you to share insights, collaborate with your team, and enable online access to your dashboards from anywhere.

Note: If a report is published from a workspace assigned to Premium capacity, users with a free Power BI license can view and interact with the report.

*

Publish the report

Publishing the report to Microsoft Power BI Service allows users to access the report online, share it with others, and enable features such as dashboards, collaboration, and scheduled data refresh.

1. In Power BI Desktop:

  • Go to Home → Publish.
  • Enter your Work or School account credentials to sign in.

*

  • A Microsoft authentication window will appear.

*

2. Click Save to save your changes.

*

3. Select the predefined workspace:

Choose “My Workspace," a personal workspace automatically created by Microsoft if no other workspace exists. This is where you can publish, manage, and test your reports before sharing them.

Note: Your default My Workspace in Power BI is private and cannot be used for sharing reports with others. To collaborate and assign roles, you need to create a separate workspace and assign users the appropriate roles (Admin, Member, Contributor, or Viewer).

*

*

4. Confirm that the report and its dataset were uploaded to Power BI Service.

*

5. Select your report to view it in the Power BI Service dashboard.

Note: Try using the navigation buttons and check if they work properly.

*

6. You can also click Edit to modify the report in the Power BI Service using a familiar editing interface.

*

*

Export the data.

Exporting data allows users to further analyze, share, or keep a copy of the report data outside of Power BI, such as in Excel or CSV format for additional calculations or reporting.

1. Export data by clicking three dots next to the visual and select.

*

2. Select summarized data to export it to an Excel or CSV file.

Note: You will need a Power BI Pro or Premium license for this.

*

3. Now you can analyze, share, or keep a copy of the report data outside of Power BI.

*

Set the sensitivity label.

Sensitivity labels are set to classify and protect data. They help control who can access, share, or edit the report and can enforce encryption, watermarking, or other security policies to keep sensitive information safe.

1. Configure Export Settings in Power BI Service.

  • In Power BI Service, go to My Workspace.
  • Locate your report, click the three dots (⋯) next to it, and select Settings.
  • Scroll down to the Export data section.

Here, you can control:

  • What data users are allowed to export.
  • How users can interact with filters in the report.

*

Create a workspace and assign roles to users.

Your default My Workspace in Power BI is private and cannot be used for sharing reports with others. To collaborate and assign roles, you need to create a separate workspace and assign users the appropriate roles (Admin, Member, Contributor, or Viewer).

*
Create a workspace.

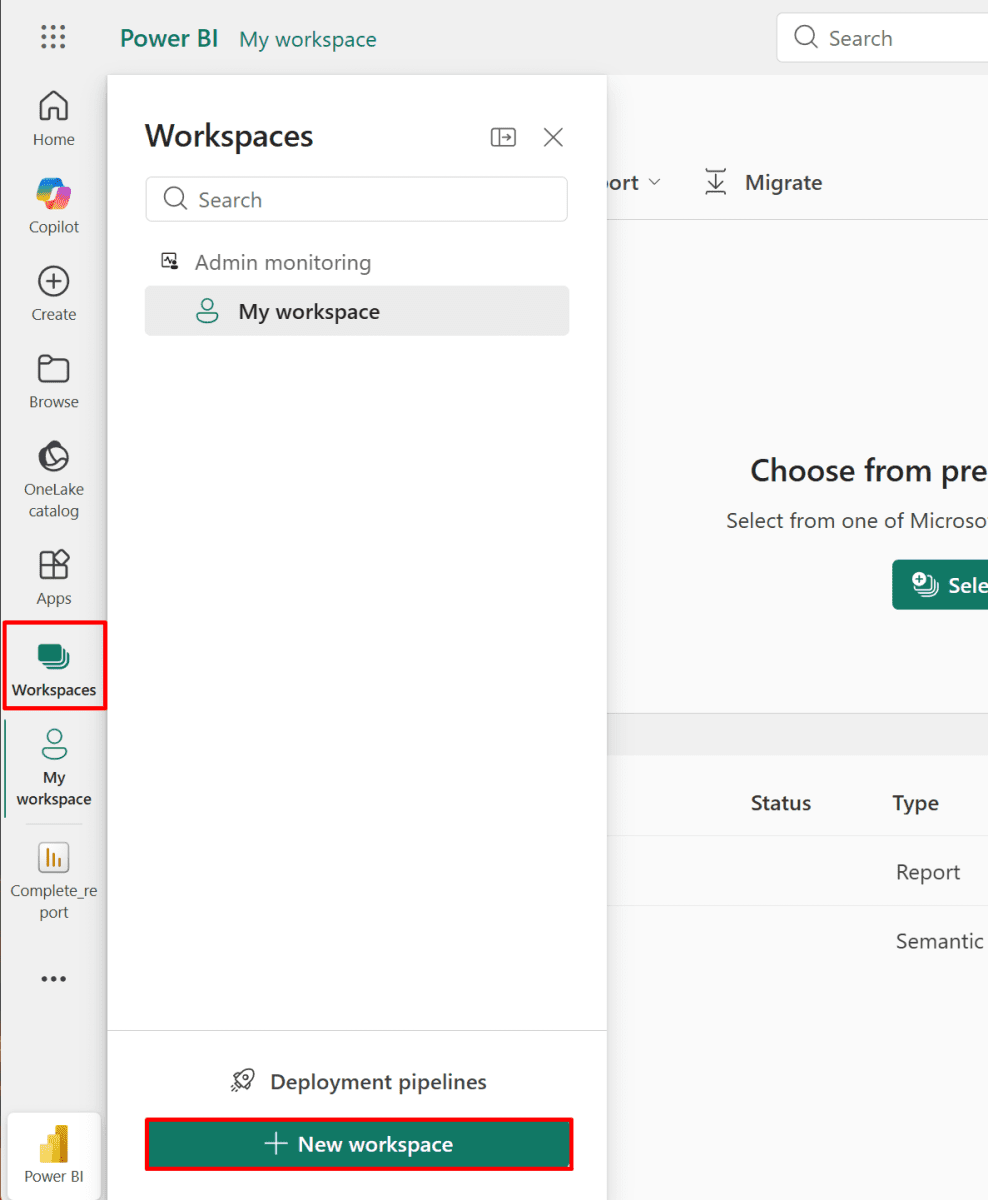
1. Select Workspaces, then click + New workspace.

*

2. Give your workspace a name, then click Apply.

*

3. Publish your report again to the new workspace you created.

Follow the previous steps, but select the newly created workspace.

Create a workspace app and set the audience.

In Microsoft Power BI, a Workspace App is created to share finalized reports and dashboards with users while restricting editing access to the workspace.

Note: If a report is published from a workspace assigned to Premium capacity, users with a free Power BI license can view and interact with the report.

*
1. Go to Power BI Service.

  • Click Workspaces.
  • Open the workspace where your report is located.
  • In the top-right corner, click Create app

Note: If “Include in app” is grayed out, you must first create a workspace app by clicking Create app in the workspace.

*

2. Provide app description and configure advanced settings ten click next.

*

Advanced Settings in a Power BI Workspace App

When publishing an app in Power BI, the Advanced settings section allows administrators to control user experience, AI features, and access behavior.

Copilot Integration.

  • Show Copilot in app navigation.
  • If enabled, users with the appropriate licenses can access Copilot within the app to:
  • Ask questions about the data.
  • Summarize report pages.
  • Generate narratives from reports.

Navigation Pane Layout.

  • Controls how the left navigation panel appears when users open the app.
  • Expand by default – Displays all report pages and sections immediately.
  • Collapse by default – Minimizes the navigation pane to icons to save screen space.

Access to Hidden Content.

  • Allows users to access hidden reports or pages through direct links or drill-through actions, even if those items are not visible in the app navigation.

Global App Settings.

  • Install this app automatically
  • Automatically installs the app for selected users or groups so they don’t need to find and install it manually.
  • Allow users to make a copy of the reports
  • Enables users to save a copy of a report to their My Workspace and customize it without affecting the original.

Support Site.

  • A URL field where you can provide a link to:
  • Internal documentation
  • A SharePoint help page
  • A help desk or support portal
  • Users can access this link from the app’s help menu.

*
3. Add your report to the app as content, then click next: add audience.

*

*

4. Customize your audience.

This screen is the Audience tab in the Power BI App publishing process. It is where you define who can see your app and what level of permission they have over the underlying data.

Note: Hide items from your audience. You can hide an item by hovering over it and clicking the hide icon. Once hidden, people can't access it or see it in the list.

  • Click + New audience and give it a name.

*

5. Define who can access your app and add permissions.

Note: You can assign users from your Microsoft Entra ID directory.

*

Advanced settings explained:

Define the Audience.

  • Create Segments: Use the + New Audience tab to create different views for different groups (e.g., "Sales" vs. "Finance").
  • Set Visibility: Click the eye icon next to reports in the left pane to show or hide specific content for the selected audience.
  • Assign Access: Use the Grant access to section to add specific people, security groups, or the entire organization.

Advanced Data Permissions.

  • The Advanced dropdown controls what users can do beyond just viewing the report:
  • Reshare Datasets: Allow users to share the underlying data with others outside the app.
  • Build Content: Grant "Build" permissions so users can create their own new reports using your app’s dataset.

Key Reminders.

  • Workspace Users: Settings applied here will also affect users who already have access to the underlying workspace.
  • Publish to Save: Changes are not live until you click Publish app.

*

6. Click Publish app to save your setting and publish the app.

Note: If you leave the Advanced checkboxes unchecked, users will have view-only access and cannot interact with or modify the app’s content.

*

7. Copy your app URL and click Go to app.

Note: This link can be shared with users, allowing them to access the app directly.

*

8. You can now see that the app has been successfully published.

Note: Your app can be found in the Apps section of the Power BI Service.

*

*

Update the reports and dashboards in your workspace.

Regularly update your workspace content, modify reports, refresh dashboards, and maintain datasets so the app always delivers accurate and up-to-date information to users.

1. Edit your report.

  • Go to your report and click Edit to modify the report in the Power BI Service using a familiar editing interface.

*

*

2. Modify your report as needed.

Note: For this example, only the background color was changed.

*

3. Save the changes you made.

*

4. Go to your workspace and update the app.

5. You can update the app directly or go through the setup again to make additional changes if needed.

Note: For this example, the only modification made was changing the app’s theme color.

*

*

6. As you can see, the app successfully updated.

*

Pin visuals and live pages to the dashboard.

Dashboards provide a quick, consolidated view of your key metrics and insights, allowing you to monitor performance and make informed decisions at a glance.

Enhance your dashboard by adding new visuals or pinning existing ones for quick access to key insights.

Pinning a live page lets you display an entire report page on your dashboard, keeping all visuals interactive and up-to-date.

*

Pin visuals.

1. Open your report, choose the visual you want to pin, and click the pin icon to add it to your dashboard.

*

2. Navigate to your workspace to locate the dashboard and click on it.

*

3. The pinned visual now appears as a tile on your dashboard.

*

4. Pin your key visuals to the dashboard for easy access. (using the same method)

*

5. Rearrange and resize your dashboard tiles as needed.

*

Pin live pages.

Pinning a live page lets you display an entire report page on your dashboard, keeping all visuals interactive and up-to-date.

1. Add a full report page to your dashboard.

  • Click the three-dot menu next to Edit, then choose Pin to dashboard.

*

2. Click Pin live to pin the full report page to your existing dashboard.

*

3. As you can see, the entire page has been added to the dashboard.

Note: Slicers and filters remain interactive on the dashboard.

Note: Changes in the report are automatically reflected in the dashboard for live-pinned pages.

*

Add and configure the Q&A feature on your dashboard and set the dashboard theme.

The Q&A feature in Power BI allows users to ask natural language questions about your data and get instant answers in the form of visuals.

Note: This feature will use synonyms that were predefined in Part 2.

*

1. You will find the Q&A feature at the top of your dashboard. Click it to activate.

*

2. You can type your question or select one of the suggested questions.

*

3. Select a suggested question, and Power BI will automatically create a visual to display the answer.

*

4. Now you can pin this visual to the dashboard.

*

*

5. The visual now appears on your dashboard.

*

6. You can also ask your own question, for example, "What is the revenue by store?” and then pin the generated visual to the dashboard.

Set the dashboard theme.

1. Click the arrow next to Edit and select Dashboard theme.

*

2. You can upload your theme JSON file, choose a predefined theme (for example, Dark), or further customize the theme to your preference.

Note: You can also download your current theme and apply it to other dashboards.

*

*

Configure the mobile layout.

To ensure that your dashboard is easy to view and interact with on smartphones and tablets, you should configure the mobile layout. Mobile devices have smaller screens, so arranging tiles specifically for mobile helps maintain readability, usability, and a better overall user experience. By customizing the mobile layout, you can control how visuals appear and prioritize the most important information for users who access the dashboard on the go.

Power BI Desktop.

Note: It is recommended to configure the mobile layout in Power BI Desktop rather than in the Power BI Service. This allows you to precisely arrange visuals, use manual adjustments, and ensure consistency across all pages. Once published, the layout automatically applies to the workspace and is visible to all users on mobile devices.

1. Go to Power BI Desktop, navigate to the View ribbon, and click Mobile Layout, then click Auto Create Mobile Layout.

Note: You can use the drag-and-drop method to organize the layout manually.

*

*

2. Configure each page using either the automatic or manual layout method.

Note: After publishing, the mobile layout from Power BI Desktop will automatically apply to the workspace and be visible to all users accessing the dashboard on mobile devices.

*

Power BI service.

Note: It is recommended to configure the mobile layout in Power BI Desktop rather than in the Power BI Service. This allows you to precisely arrange visuals, use manual adjustments, and ensure consistency across all pages. Once published, the layout automatically applies to the workspace and is visible to all users on mobile devices.

1. In Power BI Service, go to your report, click Edit, and then select Mobile layout.

*

2. You will have the same options as in Power BI Desktop: automatically create the layout or manually drag and drop to adjust the visuals.

*

3. Go back to Reading view and save the changes, or click Save in the pop-up window that appears when switching to Reading view.

*

Dashboard

You can also use the mobile layout feature in a dashboard to optimize how visuals appear on mobile devices.

1. Go to your dashboard, expand Edit, and click Mobile layout.

*

2. You can resize, rearrange, or remove visuals from the dashboard.

*

Get Insights: Automatic Data Analysis.

The “Get insights” feature in Power BI is a built-in AI-powered tool that automatically analyzes your dataset or visuals to surface patterns, trends, and key insights without manual exploration. It’s designed to help you quickly discover interesting data points, correlations, and anomalies.

1. Open your report

  • In Power BI Service, open the report that contains the dataset or visual you want to analyze.
  • Select a visual or dataset
  • Click on a chart, table, or dataset you want Power BI to analyze.
  • Access “Get Insights”
  • Click the ellipsis (…) in the top-right corner of the visual.
  • Choose Analyze → Get insights (or Explain the increase/decrease for certain charts).

*

2. Review suggested insights (~30 insights)

Power BI will generate AI-powered insights showing trends, key data points, or anomalies.

*

3. Each insight comes with a small visual and a brief explanation.

  • Interact with insights
  • Click on an insight to explore it further.
  • You can pin insights to your dashboard for easy access or include them in your report pages.

Connecting On-Premises CSV Data to Power BI Using a Data Gateway.

If a dataset is connected using a local path (for example C:\PowerBIData), Power BI Service cannot refresh it because the cloud service cannot access local drives. To enable refresh through the On-Premises Data Gateway, you need to install and configure the gateway on the machine where the file is stored. The gateway acts as a secure bridge between Power BI Service and your local data, allowing scheduled or manual refreshes of your dataset in the cloud. Once configured, you can map the local folder or file path in Power BI Service to the gateway, ensuring your reports always have up-to-date data.

The Fix:

Option A: Move the source file to OneDrive for Business or SharePoint. Update your Power BI Desktop file to point to that web location, then republish. This eliminates the need for a gateway and will reveal the refresh settings.

Option B: Install the on-premises data gateway on your Windows Server.

*
1. Try refreshing the report dataset. If you see a red triangle with an exclamation mark, it indicates there’s an error with the dataset or connection.

*

2. Go to download button and select "Data gateway."

*

3. Download and install the standard mode data gateway.

Personal Mode: Runs on your own computer, supports only your datasets, and is ideal for individual use.

Standard/Enterprise Mode: Runs on a server, can be shared with multiple users, supports many data sources, and is ideal for team or organizational use.

In this case, because the dataset is in a shared folder on the server, standard/enterprise mode is required to allow all users and the Power BI Service to access it.

Why we do this:

  • To enable scheduled or live data refresh from on-premises sources.
  • To allow multiple users and reports to access the same data securely.
  • To ensure compliance and security by keeping data inside your network while using cloud services.

Note: If you know how to install and configure the gateway in Standard mode, installing it in Personal mode will be straightforward.

*

4. Follow the installation wizard to install the On-Premises Data Gateway on your Windows Server.

*

Configure your on-premises data gateway.

1. After installation, the wizard will prompt you to sign in.

Use the Power BI account that owns the workspace where your datasets reside.

Note: You need to connect the gateway to your Power BI account.

           Power BI Service needs to identify your gateway and authorize it for data access.


*

2. Select "Register new gateway on this computer" and click next.

*

3. Register the Gateway.

  • Give the gateway a name and recovery key.
  • This allows multiple users to use the gateway and ensures it can be recovered or moved if needed.
  • Enter a friendly name for your gateway (e.g., Server2025-PBI-Gateway).
  • Create a recovery key (strong password) and store it safely.

Important: The recovery key is needed if you ever reinstall or move the gateway.

*

4. Verify that the gateway is online and ready for use.

*

5. When you try to refresh the dataset, you may still see an error.

Click See details to view more information.

*

6. The error indicates that you need to enter your credentials again.

Note: This usually happens when the dataset uses a local or network data source (for example, a shared folder or local file), and the gateway or credentials are not configured in Power BI Service.

*

7. Go to dataset settings.

*

3. Fix the file path and provide windows credentials.

  • Click add to gateway

Note: You will need to repeat these steps for each file path that shows an error.

*

4. Provide a connection name, make sure the file path is correct, enter the Windows credentials, and click Create.

*

5. Repeat these steps for each file path that shows an error.

By mapping those connections, you’ve effectively told Power BI exactly which "lane" each piece of data should take across the gateway bridge.

Click the Apply button at the bottom of the screen. If you navigate away without clicking Apply, the mappings might reset, and your scheduled refreshes will still fail.

*

6. Now, when you click Refresh, the dataset refreshes successfully.

Set scheduled data refresh.

1. Click on scheduled refresh next to semantic model.

*

2. Set the refresh frequency to daily or weekly and click Apply.

*

*

Set up subscription and data alerts.

In Microsoft Power BI, subscriptions and data alerts help users stay informed without needing to constantly check dashboards or reports. These features allow Power BI to automatically notify users when reports are updated or when important data reaches a specific value.

Subscriptions allow you to schedule automatic email notifications that include a snapshot of a report or dashboard. This is useful for regularly monitoring business metrics such as sales performance or operational reports.

Data alerts notify users when a value in a dashboard tile crosses a defined threshold. For example, you can receive an alert if revenue drops below a certain level or if sales exceed a target.

By configuring subscriptions and data alerts, organizations can ensure that key stakeholders receive timely updates and can quickly respond to important changes in their data.

Subscription.

1. Go to your report and click Subscribe.

  • Click Create subscription.
  • Enter a name for the subscription.
  • Select the recipient(s).
  • Configure the remaining settings as needed.
  • Click save.

*

2. Click the Subscribe button again to see the subscription. You can modify or delete it from there.

Note: You can also subscribe directly from your dashboard.

*

3. The email looks like this:

*

Data alerts.

Data alerts can be set in the dashboard for specific tiles.

Data alerts only work for certain visuals:

  • Card visual
  • KPI visual
  • Gauge visual

1. On the dashboard expand the three-dots menu and select Manage alerts.

*

2. Click + Add alert rule

Fill up the details.

In this example you will receive a notification if the revenue falls below $198K.

Note:

  • Alerts are set per user, not per dashboard.
  • Each user must create their own alert on the dashboard tile.
  • You cannot configure one alert that automatically notifies multiple people.

*

Create RLS roles and assign group members in Power BI Desktop.

Row-Level Security (RLS) lets you restrict data access so users only see what they’re allowed. In Power BI Desktop, you create roles with filters and assign users or groups to them. Once published, these rules control what each user sees in the report.

*
1. In Power BI Desktop, open the Modeling tab and select Manage Roles.

*

2. Create a role that allows viewing only the data related to Arizona.

  • Create a new role and name it Arizona.

*

3. Create a new rule.

  • In the right-hand Rules column, click the + New button
  • A drop-down will appear.
  • Select the column name that contains your states (e.g., "State").
  • In the next box, leave the operator as Equals.
  • In the value box, type Arizona.
  • Click the green Save button at the bottom right.

Note: You created the role (the logic: "Only show Arizona"), and now you assign users (the people) to it. It allows you to share one report with the whole company while ensuring each person only sees the data relevant to them.

*

4. Publish this configuration to your workspace.

*

5. Once saved, you should verify it works. Go back to your report, select the Modeling tab, and click View as. Select your new Arizona role. If everything is correct, all your charts should suddenly update to show only Arizona data.

*

*

5. Once you set up a role, you can assign the role to users or groups in Power BI Service.

  • Go to the workspace where you published the report.
  • Find the Semantic Model (the one with the orange icon).
  • Click the three dots (...) next to the name and select Security.

*

6. Add Your Users

You will see a list of roles on the left.

Click on your Arizona role.

In the "Members" box on the right, type the email addresses, security groups, or distribution lists for the people who should only see Arizona data.

  • Click Add, then click Save, and then add and save again.

*

7. Test this role.

Click the three dots next to the Arizona role to test as a role.

*

*

Important:

The "Viewer" Role: Users must be added to the Workspace as Viewers. If you add someone as an Admin, Member, or Contributor, they have "Edit" permissions. Power BI assumes editors need to see all data to fix the report, so it ignores RLS for them.

Organizational Email: You can only add users within your organization (or guest users already in your Entra ID/Active Directory).

*

Grant users or groups access to the dataset.

After setting up your reports and RLS roles, you need to give users or groups access to the dataset in Power BI Service. This ensures they can view, interact with, and use the reports and dashboards you’ve created.

Benefits:

  • Controlled Access: Only authorized users can see or interact with the data.
  • Collaboration: Teams can work with the same dataset without duplicating it.
  • Security Compliance: Helps maintain data privacy and enforces RLS rules effectively.

1. Go to your project.

  • Click update app.

*

2. Go to the audience tab.

App Audiences in Power BI allows you to control exactly who sees what when you publish your reports as an "App" for the rest of your company.

*

Explanation:

Grant Access To

  • Specific users or groups: This is where you type in the email addresses of the people who should have access to this specific "Audience" (e.g., the Arizona team).
  • Entire organization: Choosing this makes the app visible to everyone in your company.

Advanced Settings

  • These two checkboxes give your users "Super User" powers over the underlying data:
  • Allow people to share the datasets: If checked, users in this audience can "reshare" the raw data with others outside the app.
  • Allow people to build content: this gives them build permission. They can use your semantic model to create their own separate reports in their own workspaces.

Workspace Users Warning

  • The yellow box is a reminder that Workspace Users (like "John Smith" shown at the bottom) are the admins/owners.
  • Because John Smith is a workspace user, he will always have access to everything in the app, regardless of what audience settings you choose.
  • You cannot restrict John's view using these audience toggles; you'd have to remove him from the workspace itself to do that.

*

3. The "Manage Permissions" page is the central hub for Direct Access. Here is the simplest way to think about how this differs from the App Audience settings we discussed earlier:

Direct Access (manage permissions)

  • What it is: Permanent, item-level permission. It’s like giving someone a physical key to a specific room (a report or a model).
  • When to use it: When you want to share one specific item with a colleague without them needing to install an entire App.

Key Detail: As you can see with "John Smith," it shows his permissions were granted via the App. This screen "sees" everything, regardless of how the person got access.

App Audience (The Previous Screen)

  • What it is: A "Front Door" for a collection of reports. It’s like a hotel lobby where you decide which group of guests can see which floors.
  • When to use it: For formal distribution to a large group of "end users." It provides a cleaner, more professional interface than sharing direct links.

*

*

4. Roles can also be assigned from the Manage Permissions page.

Note: To remove access, use the three-dot menu beside the user.

*

*

Roles

Description of the roles you can assign to a Power BI workspace:

Admin – Full control over the workspace. Can add or remove members, change roles, manage workspace settings, and publish or delete content. Essentially the owner of the workspace.

Member – Can create and edit reports, publish apps and content to the workspace, and share reports and dashboards. Cannot manage workspace settings or users.

Contributor – Can create and edit content (reports, dashboards, datasets), publish and update reports, edit datasets, and delete content they own (dashboards). Cannot add or remove users, change workspace settings, or publish apps/share dashboards.

Viewer – Read-only access. Can view reports and dashboards but cannot create, edit, or publish content.

*

Conclusion:

By following these steps, you will have a fully configured Power BI environment that is secure, collaborative, and insight-driven. Users can interact with dashboards, receive timely alerts, and view only the data they are authorized to access. Implementing these practices ensures better data governance, improved decision-making, and a consistent experience across reports, dashboards, and mobile devices.

*

Written by Kirill.A - Azure & Cybersecurity Consultant at AntusNet

➤ Want more? Browse all our Azure implementation guides.

Need help implementing secure Azure solutions?

Contact us for a free consultation.

    error: Content is protected !!