Loading...

Azure Quick Links

*

Microsoft Fabric

 Fabric Data Engineering & Analytics Pipeline

*

*

*

Azure Cloud Projects

Microsoft Fabric Data Engineering & Analytics Pipeline

This project demonstrates an end-to-end Microsoft Fabric implementation, covering workspace setup, Lakehouse creation, and data ingestion using CSV and JSON files with Delta tables and Dataflow Gen2. It includes querying data through the SQL Analytics endpoint, building visual queries, managing shortcuts, and configuring access, permissions, and sharing. The project also integrates OneLake File Explorer, SSMS, and Power BI Desktop to enable a complete analytics workflow from data storage to visualization.

Task Details

1. Sign up to Microsoft Fabric with work account.

2. Microsoft Fabric pricing.

3. Create a Microsoft Fabric workspace.

4. Create a Lakehouse within your Fabric workspace.

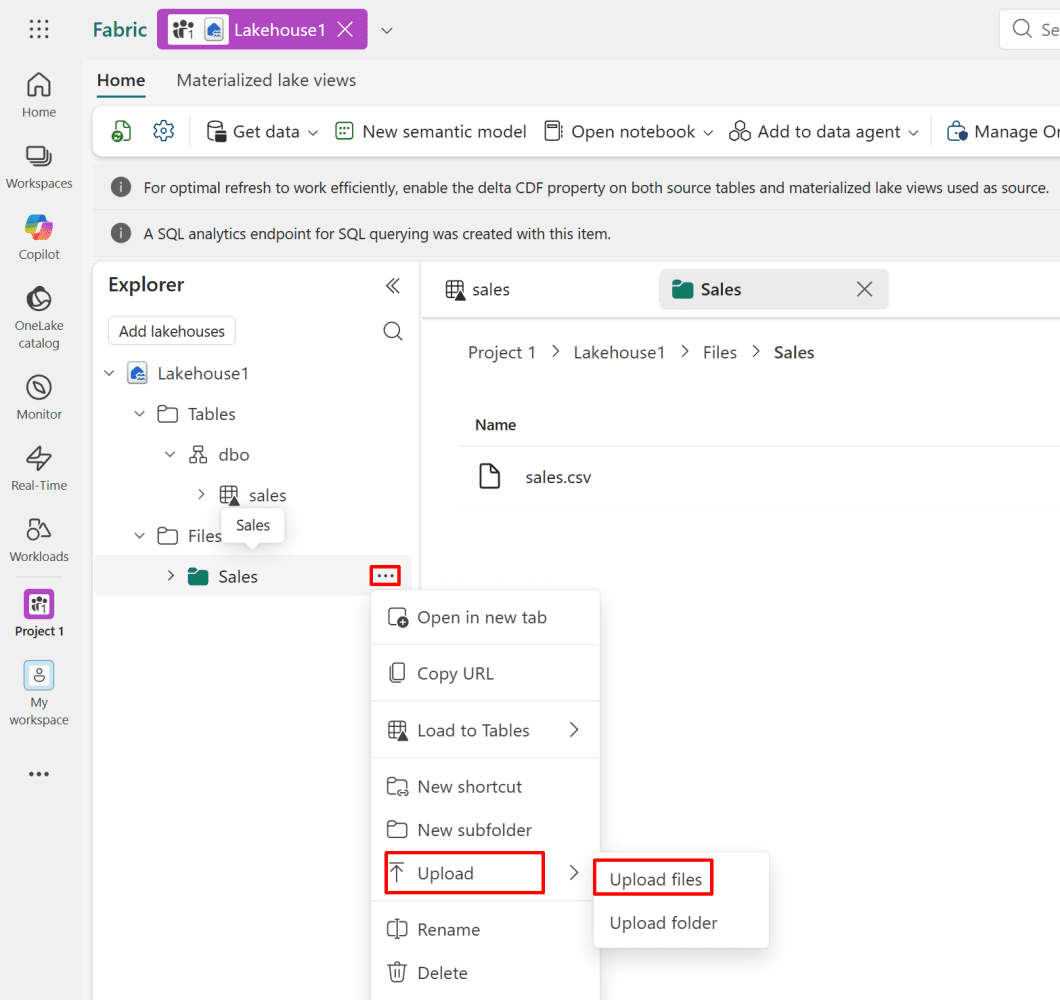
5. Load and append CSV data into Delta tables.

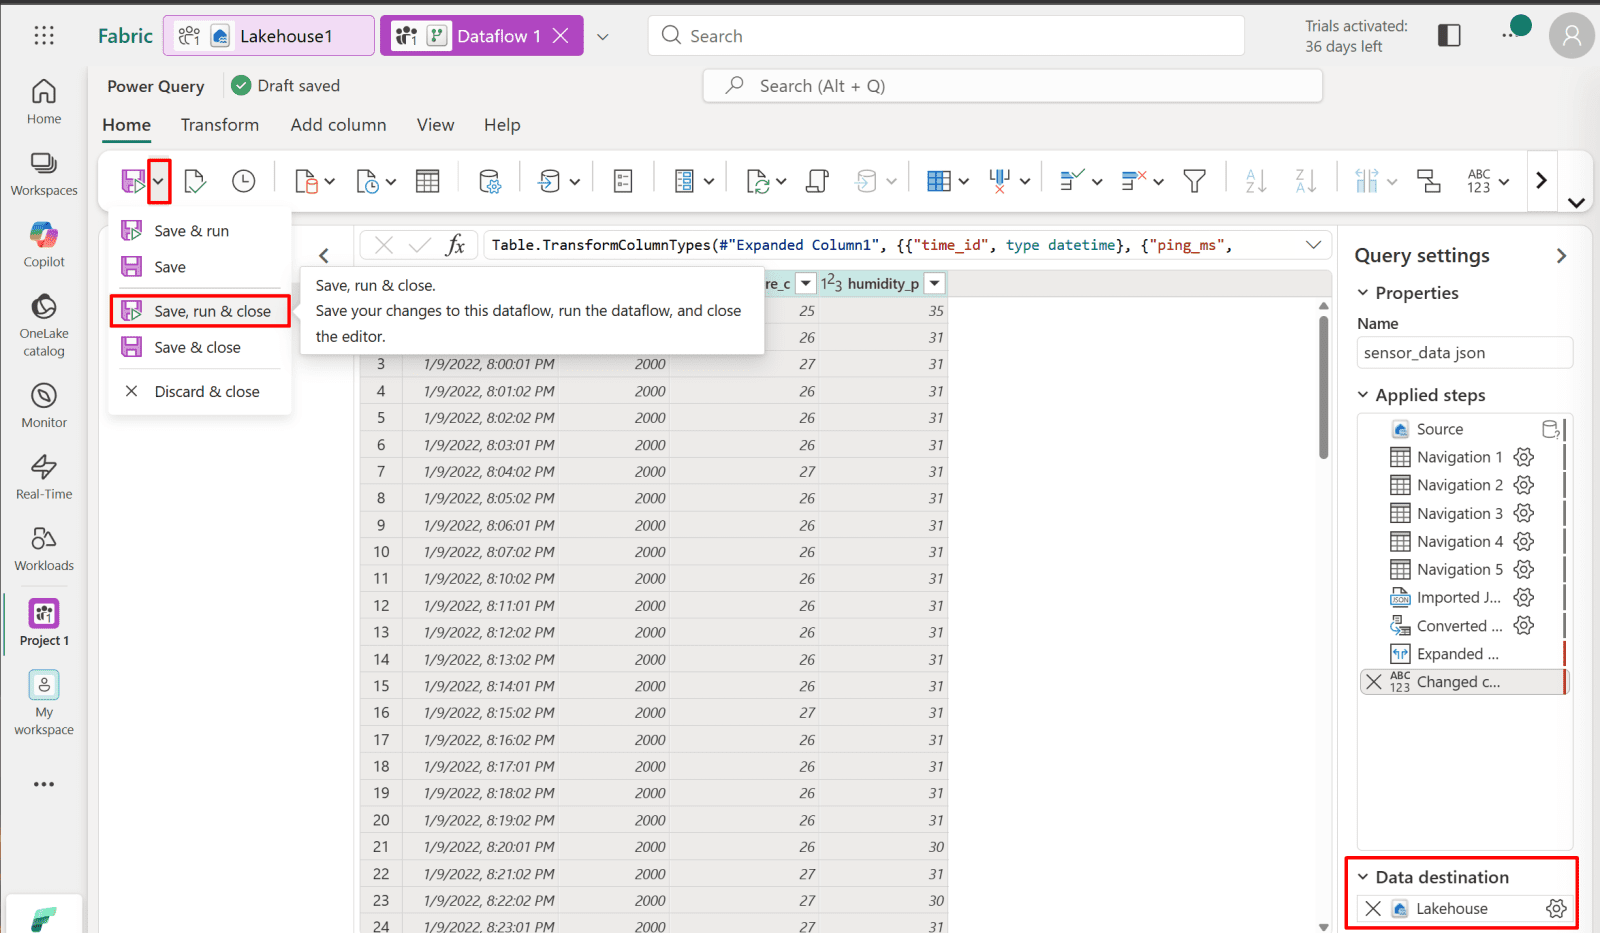
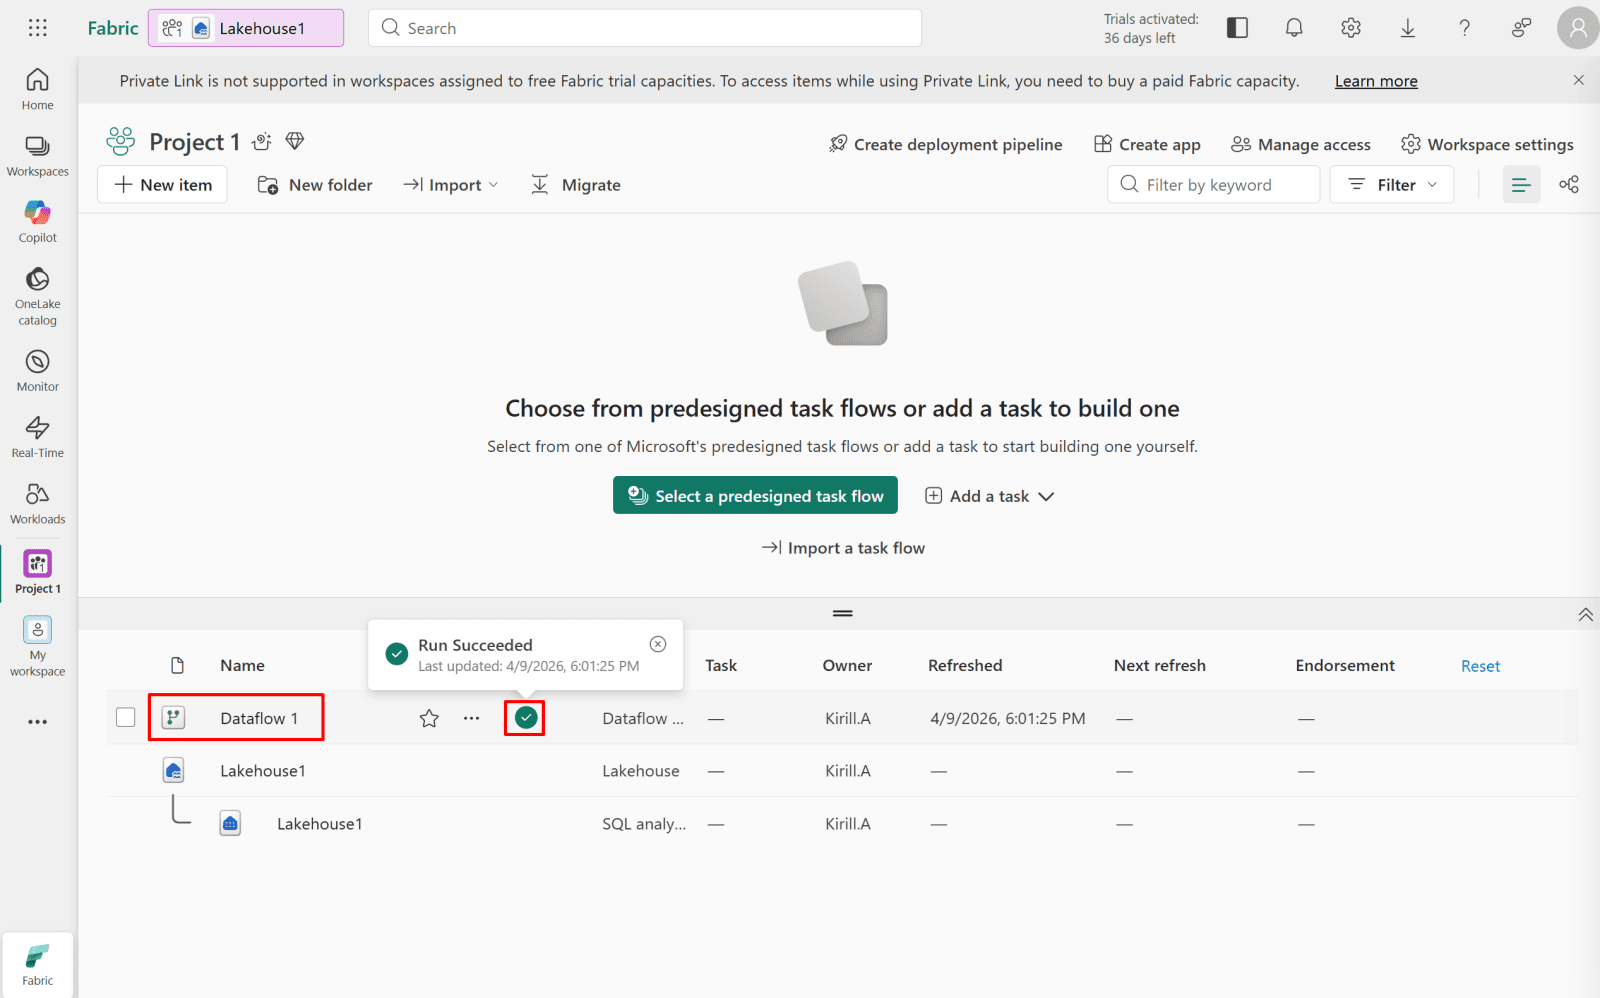
6. Load JSON data into Delta tables using Dataflow Gen2.

7. Query data using the SQL analytics endpoint.

8. Create a visual query.

9. Create shortcuts.

10. Manage access, permissions, and sharing.

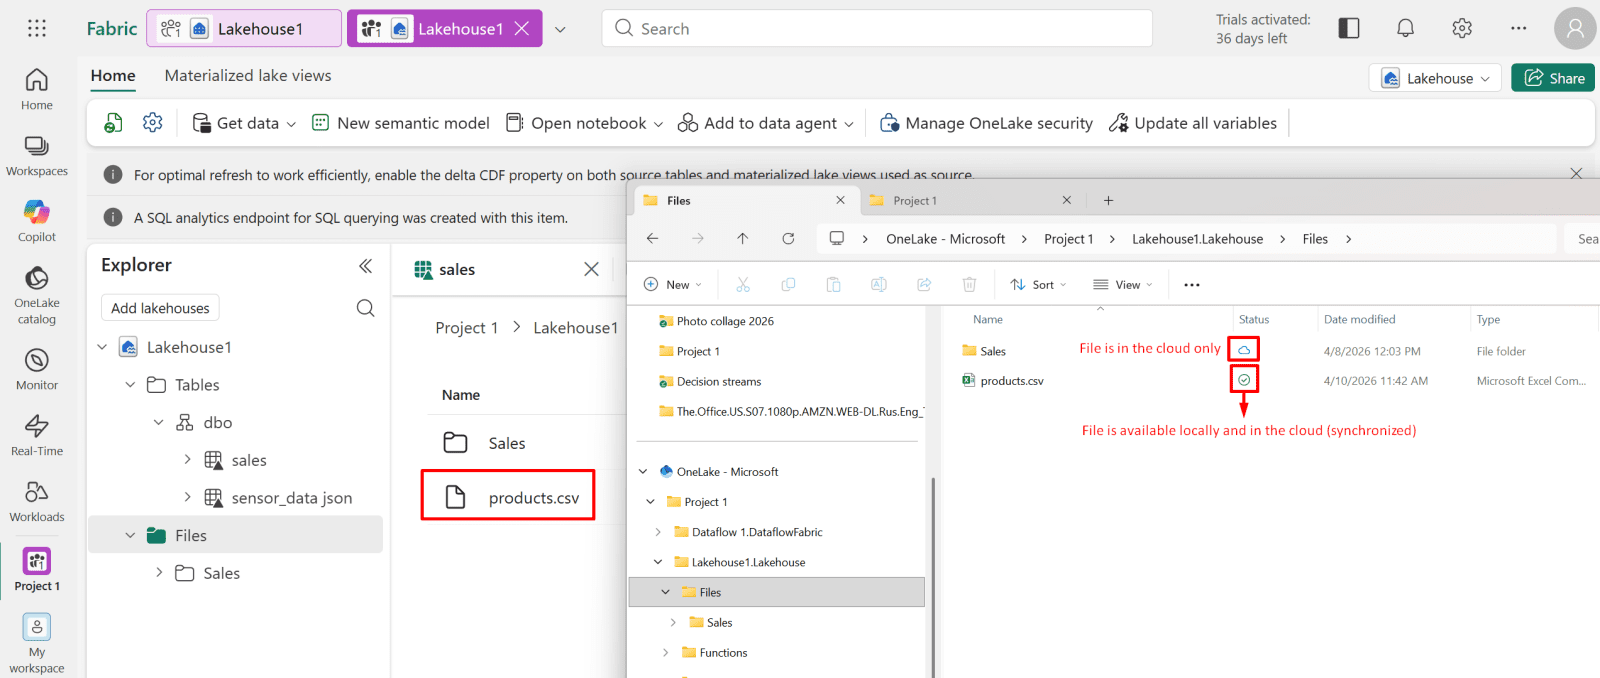
11. Sync Your Files with OneLake File Explorer to Your Workspace.

12. Connect SSMS to a Fabric Lakehouse SQL Analytics Endpoint.

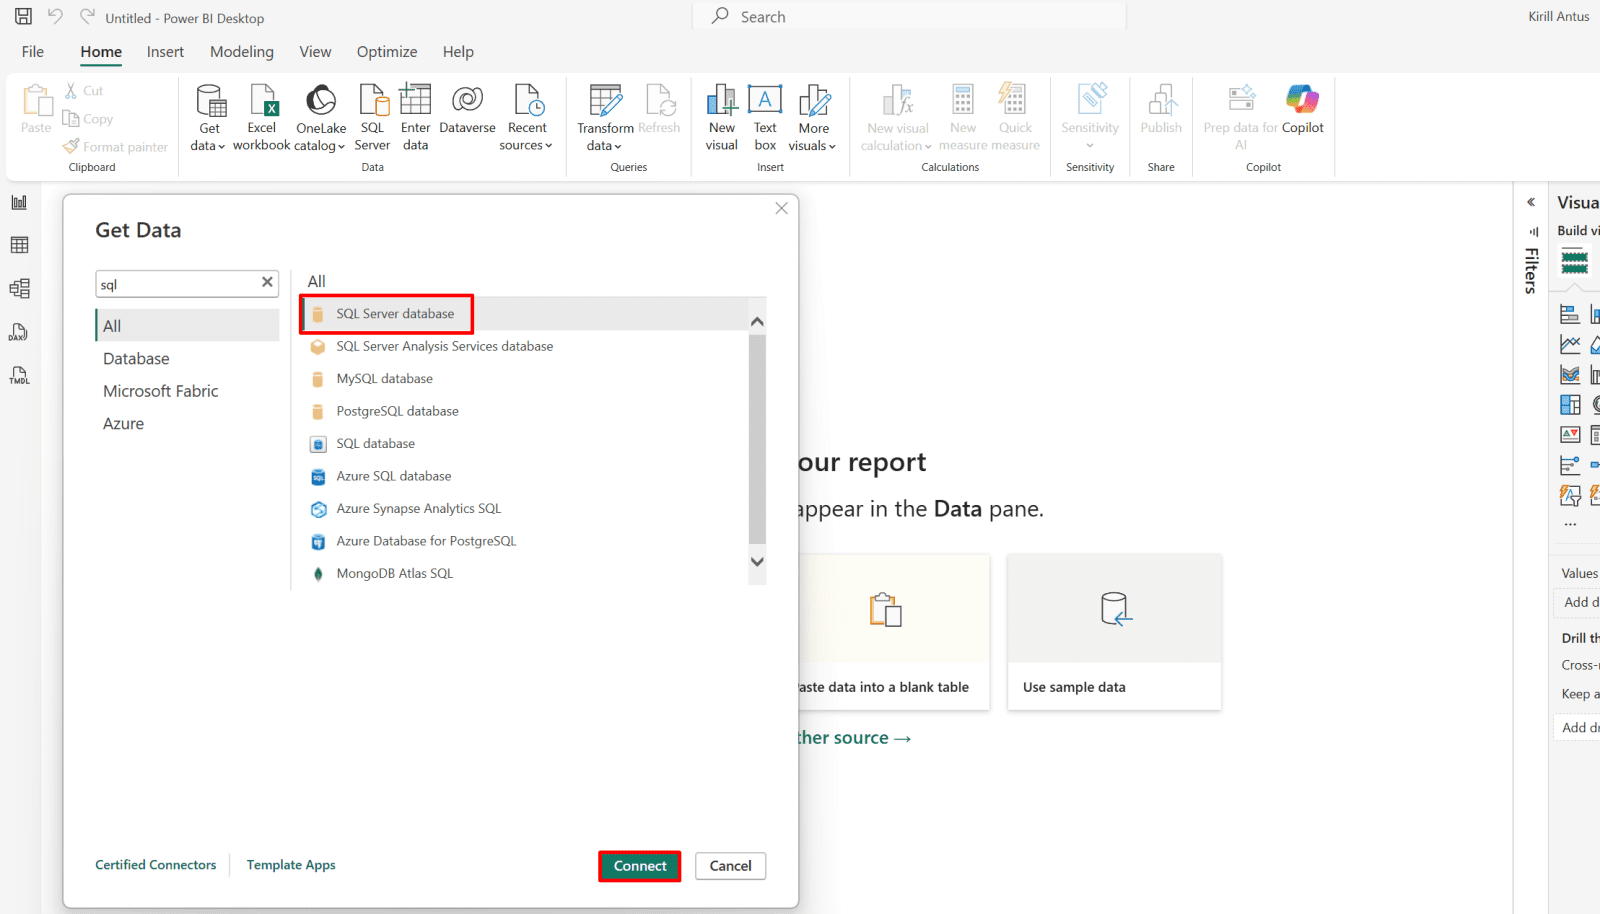
13. Connect Power BI Desktop to a Fabric Lakehouse SQL Analytics Endpoint.

*

All files used in this project are located here

*

Steps

Sign up to Microsoft Fabric with work account

Any Microsoft Entra ID account that exists in a Microsoft 365 tenant can access the Power BI /Fabric Service, as long as:

  • The account has a Work or School account type (all Entra ID accounts in your tenant automatically are).
  • A Microsoft Fabric / Power BI license determines the level of access:
  • Free → personal use (My Workspace only)
    Pro / Premium Per User → sharing, collaboration, workspace access

Here’s how it works:

  • Entra ID account → identifies the user in your tenant.
  • License assignment → tells Power BI what features the user can access.
  • Microsoft Fabric → allows the account to log in, access workspaces, refresh datasets, and create reports.

Note: You can activate a free 60 days Microsoft Fabric Pro trial to test all features, including report creation, sharing, and workspace collaboration, before purchasing a license.

Note: You must use a Work or School account to create and use a Microsoft Fabric service account. Personal email accounts (such as Gmail or Outlook.com) are not supported in Microsoft Fabric Service. The account must be created within your organization’s tenant in Microsoft Entra ID and assigned an appropriate Microsoft Fabric license.

Note: Although a Microsoft Fabric Service sign-in is possible using a Global Administrator account, it is not recommended to use Global Admin accounts for Microsoft Fabric automation or service tasks. Instead, create a dedicated Work or School service account in Microsoft Entra ID and assign only the required Microsoft Fabric license and workspace permissions. This follows the principle of least privilege and improves security.

*

2. If free trial is not available, go to admin portal and enable “Users can create Fabric items."

*

*

3. In Microsoft Fabric home screen, featuring options to create new workspaces using task flow templates and access various data analytics tutorials.

*

Microsoft Fabric pricing.

Microsoft Fabric pricing helps you understand the costs associated with using Fabric, including the free trial, storage, compute, and advanced features, so you can plan your project accordingly.

*

Microsoft Fabric pricing

Microsoft Fabric costs are made up of several key components:

  • User Licenses – Users need Power BI Pro or Premium Per User (PPU) licenses to create, share, or collaborate on reports and dashboards. Free users can only view content in capacity-backed workspaces.
  • Capacity (SKU) License – Defines the compute and memory allocation for a workspace. SKUs (like F64) determine performance and available features.
    Storage – Charges apply for data stored in your workspace, including datasets, files, and other assets.
  • SQL Storage / Compute – Using Fabric SQL endpoints or dedicated storage for large datasets may incur additional costs depending on size and performance tier.
  • Bandwidth (Data transfer) – Intra-region traffic (within the same Azure region) is usually free. Inter-region traffic or data sent to the public internet may incur charges based on Azure’s bandwidth pricing.

Quick Notes:

Power BI Pro or Premium licenses are required for users, as Microsoft Fabric relies on Power BI for sharing, collaboration, and report publishing.

In short, users need the appropriate license to access and interact with Fabric data and reports.

Fabric capacity is a pool of compute and storage resources assigned to a tenant. Each tenant starts with a default capacity that can be shared across workspaces, and additional capacities can be added to scale performance or isolate workloads.
A SKU (Stock Keeping Unit) defines the pricing tier and feature set of a Fabric capacity, determining the level of performance and capabilities available.

In short, the main cost components in Microsoft Fabric are user licenses, capacity SKU, storage, SQL resources, and bandwidth.

*

Power BI pricing

*

Fabric Capacity (SKU)

*

Storage & SQL Storage

*

Bandwidth (Data transfer)

*

Create a Microsoft Fabric workspace.

A Microsoft Fabric workspace is the foundational environment where you create, manage, and organize your data, analytics, and integration resources. In this step, you will create a new workspace to begin building and securing your Fabric solutions.

Note: A workspace is like a folder or container where you keep all your project resources.

1. In the Workspaces tab, click New workspace.

*

2. Give your project a name and description.

*

3. Scroll down and select Fabric Trial to access all the features available in the free trial.

  • Click Apply

*

4. Now you can create new items in your workspace.

*

5. One of the biggest advantages is that we can now create and manage Microsoft Fabric, Power BI, and other tools seamlessly under the same platform. This unified experience not only simplifies workflows but also makes data management, visualization, and analytics feel truly integrated and effortless.

Note: You can navigate between Fabric, Power BI, and other resources by clicking the button in the bottom-left corner and selecting the desired view.

*

Create a Lakehouse within your Fabric workspace.

A Lakehouse in Microsoft Fabric is a unified storage and analytics platform that combines the flexibility of a data lake with the structure of a data warehouse. Creating a Lakehouse allows you to store, manage, and analyze both structured and unstructured data in one place.

*
1. In your project, click + New and select Lakehouse.

*

2. Enter a descriptive name for your Lakehouse and click Create.

Note: A SQL Analytics endpoint is created automatically with your Lakehouse. It’s your direct connection to run SQL queries on the Lakehouse data, perfect for analysis with Power BI, Excel, or Fabric notebooks without moving any data.

*

Load and append CSV data into Delta tables.

In this step, you’ll bring your data into the Lakehouse and organize it into tables, making it ready for querying, transformation, and analysis.

Note: The Lakehouse uses a hierarchical structure to manage data, organizing files and folders in a way similar to a traditional file system. This makes it easy to store, navigate, and manage both raw files and structured tables.

*

Load data into your Lakehouse.

1. Create a subfolder, then upload the sales.csv file into that folder.

In the Explorer pane, locate the Files section.

Click the ellipsis (...) next to the folder where you want the new directory.

Select "New subfolder" from the dropdown menu to name and add your folder (sales in this case).

*

*

2. Upload the sales.csv file to the Sales subfolder.

Download the CSV file from here.

In the Explorer pane, click on the Sales subfolder to make it your active location.

  • Click the Get data button in the top toolbar.
  • Select Upload files from the dropdown menu.

*

  • Browse for your file and click Upload to save it directly into the selected folder.

*

*

3. Open the uploaded file and switch to Table View for a clearer view of the data.

Note: Use the first row of your data as the column headers to ensure proper table structure.

*

Load and append CSV files into Delta tables.

1. Load your data into Delta tables to organize it for reliable and fast analysis.

In File View, click the (...) next to your file, choose Load to Table, and then select New Table to create a Delta table from your data.

*

2. "Use the header for column names" should be selected, and then click load.

Note: Ensure column names use Unicode characters and avoid spaces to prevent errors during querying and processing.

Note: If the Load to Table process appears to freeze or fail, it may be caused by a VPN connection (e.g., Private Internet Access). Try temporarily disconnecting your VPN and retrying the operation.

*

3. As you can see, the table was successfully loaded into the schema.

*

4. You can also upload a second file and append its data to the existing sales.csv file.

Upload the sales_2.csv file to the Sales subfolder.

Download the CSV file from here.

  • In the Explorer pane, click on the Sales subfolder to make it your active location.
  • Click the Get data button in the top toolbar.
  • Select "Upload files" from the dropdown menu.

*

  • Browse for your file and click Upload to save it directly into the selected folder.

*

5. In Explorer, click the (...) next to your file, select “Load to Table,” and then choose an existing table to append sales_2.csv to sales.csv.

*

6. Select the table to append to, choose “Append,” and ensure that “Column headers” is checked.

Note: If the Load to Table process appears to freeze or fail, it may be caused by a VPN connection (e.g., Private Internet Access). Try temporarily disconnecting your VPN and retrying the operation.

*

7. Verify that the data has been appended successfully.

*

8. You can also check which command Fabric uses when appending the files.

  • In Explorer, click the (...) next to your file and select “View files”

*

9. Here, you can see all the files that Fabric created. Click on the _delta_log file to view the commands Fabric used to append the files.

*

Load JSON data into Delta tables using Dataflow Gen2.

Since JSON files cannot be loaded using the same method, use the New Dataflow Gen2 approach to create the table.

Dataflow takes messy, semi-structured JSON → organizes it → and saves it as a clean, structured table ready for analysis.

1. Upload the sensor_data.json file to the Files subfolder in the Lakehouse.

*

2. Create a Dataflow Gen2 in the workspace.

From the workspace (here, Project 1), click on "create new item" and search for "Dataflow Gen 2."

*

3. Enter a meaningful name for the Dataflow to easily identify it later. Click “Create.” Power Query will open.

*

4. In Power Query, create a new data source and select “Lakehouse,” since the JSON file is located in the Lakehouse.

  • Click "Get data."

*

5. Search and select Lakehouse.

*

6. Use default settings and click next.

*

7. Select the sensor_data.json file and click create.

Note: Avoid using !(Current Workspace) as it can sometimes cause reference issues in Dataflows.

*

8. After clicking “Create,” Power Query will open, similar to Power BI.

Note: Opening a JSON file in Dataflow = extract → transform → load (ETL) into a structured Delta table.

*

9. Convert the JSON file into a table.

We convert a JSON file into a table because JSON is not efficient for analysis on its own, while tables (like Delta tables) are designed for querying, reporting, and processing.

  • Click on To table then OK (use default settings)

*

10. You can see that there is only one column, so you need to expand it by clicking the icon next to Column1, and then click OK.

*

11. Now you can see the table in a standard format.

*

12. Automatically detect the data type by selecting all columns and clicking Detect data type.

*

13. Define the destination for the transformed table as a Lakehouse.

We choose a Lakehouse as the destination so the transformed data is saved in a structured, optimized format that can be reused for reporting, analysis, and modeling.

  • Click on the "+" icon next to "Data destination" and select "lakehouse."

*

14. Click Next.

*

15. Select where you want to create the JSON table.

*

16. Use automatic settings and click Save settings.

*

17. Now you need to publish it (i.e., run it).

We publish it because nothing actually runs or gets saved to the Lakehouse until you do.

  • Click Save run & close

*

18. Navigate to the workspace and confirm the status.

*

19. This is the context menu for Dataflow 1 in your Project 1 workspace. Here's what each option does:

Most Useful for You Right Now

Open - Opens the Dataflow in Power Query editor to edit your data transformations
Refresh now - Runs the Dataflow immediately - this is how you trigger the append manually.
Schedule - Sets it to run automatically (daily, weekly, etc.) — useful for recurring appends.
Recent runs -  Shows history of past runs - check if it succeeded or failed with errors.
Check validation - Validates the Dataflow for errors before running.
*
Less Urgent But Good to Know

Settings - Change connection credentials, gateway settings.
Favorite - Pins it to your favorites for quick access.
View workspace lineage - Shows how data flows across all items in the workspace.
View item lineage - Shows dependencies specific to this Dataflow.
View details - Shows metadata,created date, owner, description.
Move to - Move the Dataflow to a different workspace.
Save as - Duplicate the Dataflow as a new one.
Delete - Permanently deletes the Dataflow.

*

20. Ensure that the table data is loaded correctly and appears as expected in the Lakehouse.

Query data using the SQL analytics endpoint.

A SQL Analytics endpoint is created automatically with your Lakehouse. It’s your direct connection to run SQL queries on the Lakehouse data, perfect for analysis with Power BI, Excel, or Fabric notebooks without moving any data.

The SQL Analytics endpoint in Microsoft Fabric provides a SQL-based interface for querying and analyzing Lakehouse data using standard T-SQL. It also supports external connections via a connection string, allowing tools such as Power BI and SQL Server Management Studio (SSMS) to connect directly for reporting and analysis without moving or copying the data.

1. Navigate to the SQL Analytics endpoint from your workspace.

*

2. Run a SQL query to display only specific columns, then save the view.

We save the view for a few practical reasons:

  • Focus only on needed data: Instead of working with the full table, you reduce it to only the columns relevant for analysis or reporting.
    Simplify reuse: Saving it as a view lets you reuse the same query without rewriting it every time.
  • Improve clarity for reporting tools: Tools like Power BI work better with clean, pre-filtered views instead of raw wide tables.
    Better organization: It helps separate raw data from curated “ready-to-use” datasets.

In short: you’re creating a clean, reusable, and optimized data layer for analytics.

Run the following query to retrieve specific transaction details (Transaction ID, Timestamp, and Total Price) from the sales table:

Copy query

SELECT
Transaction_ID,
Timestamp,
Total_Price
FROM sales

*

3. Note that your queries are saved under My Queries, allowing you to reuse and run them again without rewriting.

Note: You also can rename the query as needed.

*

4. Save your query as a view.

Select the entire query, then click "save as a view."

*

5. Give it a name, then click OK.

*

6. Your saved views will be saved under Views.

*

Create a visual query.

Visual query allows you to explore, build, and analyze your data using a graphical, drag-and-drop interface instead of writing SQL manually. It helps you quickly join tables, filter data, and shape results in a more intuitive and visual way, making data exploration easier and more accessible.

1. You can find the visual query under New SQL query.

*

2. Drag and drop the Sales table onto the canvas to visualize the data and begin building your query.

What You Can Do From Here:

  • Manage columns – select/remove/rename columns
  • Reduce rows – filter data
  • Sort / Transform / Combine – shape your data
  • Save as View – persist the query
  • View SQL – see the auto-generated SQL behind the visual query
  • Download as Excel or Visualize results

*

3. You can drag and drop the Total_Sales table to combine, transform, and group it with the Sales table for further analysis. This works very similarly to how you build relationships and transformations in Power BI.

Note: You can also save your steps as a view and reuse them later for future queries and analysis.

Note: It also will appear under My queries.

*

Create shortcuts.

We create shortcuts to make data access easier and more efficient.

Instead of copying or moving data into your Lakehouse, a shortcut lets you point directly to data stored elsewhere (like another Lakehouse or external source). This helps because:

  • No data duplication – you avoid copying large datasets
  • Faster setup – data becomes available instantly
  • Single source of truth – everyone works with the same data
  • Easier management – updates in the source are automatically reflected
  • Better scalability – less storage and maintenance overhead

Note: Shortcuts let you use data where it already lives, without moving it.

1. Create a second Lakehouse where you will use a shortcut to the Sales table instead of copying it.

  • From your workspace, click on "New item" and then select "Lakehouse."

*

2. Give your new Lakehouse a name, then click Create.

*

3. Click Get data, then select New shortcut.

*

4. Select Microsoft OneLake.

Note: You can also create shortcuts from various external data sources as well.

*

5. Select Lakehouse1, then click Next.

*

6. Check the sales table, then click Next, then click Skip.

*

7. Click create to create a shortcut.

*

8. With shortcuts, you can work with the data in the same way as if it were physically stored in your Lakehouse. You can query, transform, and analyze it without copying or moving the underlying data.

Important: Since the shortcut is created within Microsoft OneLake, it references the same underlying data rather than copying it. Any changes made to the data through the shortcut will directly affect the original source table.

Manage access, permissions, and sharing.

Manage access, permissions, and sharing within your workspace. This ensures that only authorized users can view or modify data, helping you maintain security, control data usage, and enable collaboration across teams.

1. From your workspace, click on Manage Access.

*

2. Click Add people or groups.

*

4. Here you can select users from your organization and grant permissions to them.

Click "Add" when you're done.

*

5. Here you can change roles for the users.

Note: Here you can check the differences between roles here.

*

Sharing

Share items in Microsoft Fabric, allowing you to securely provide access to reports, datasets, and Lakehouse assets with other users or teams.

1. From your workspace, share Lakehouse1 with another user.

  • Click the Share icon or expand the menu by clicking (...) next to Lakehouse1.

*

2. Select the user and assign the required permissions, then click Grant.

*

3. Open Manage permissions for Lakehouse1.

  • Click the (...) next to Lakehouse1 and select Manage permissions.

*

4. You also can manage permissions from here.

Sync Your Files with OneLake File Explorer to Your Workspace.

In this section, you will use OneLake File Explorer to synchronize files from your local machine to your workspace. This allows you to easily upload, manage, and keep your data in sync with your Lakehouse, making it accessible for further processing and analytics within Microsoft Fabric.

Download OneLake from here.

*

1. Install OneLake File Explorer, then authenticate to Microsoft Fabric.

After successful authentication, OneLake File Explorer will appear in Windows File Explorer on the left side as a synced location, allowing you to access your Fabric workspace files directly from your local machine.

*

2. You can now download and upload files just as you would in Windows File Explorer.

Copy and paste the desired file into your Sales folder (in this case, products.csv).

Download products.csv from here

*

3. It is worth mentioning that the cloud icon indicates the file is stored only in the cloud, while the check mark icon indicates the file is available both locally and in the cloud (synchronized).

Note: Don’t forget to refresh Fabric to see the file you copied.

*

Connect SSMS to a Fabric Lakehouse SQL Analytics Endpoint.

Connect SQL Server Management Studio (SSMS) to a Microsoft Fabric Lakehouse SQL Analytics Endpoint, allowing you to query and manage your Lakehouse data using familiar SQL tools.

1. Get Your Connection String from Fabric.

Go to Microsoft Fabric, then to your Workspace, and open the Lakehouse SQL Analytics endpoint.

*

2. Click on Settings (gear icon), then select SQL endpoint connection string and copy it.

*

2. Connect to SSMS using the connection string.

  • Open SQL Server Management Studio

In the Connect to Server dialog, fill in:

Server=XXX.datawarehouse.fabric.microsoft.com;
Database=YourLakehouseName;
Authentication=Active Directory Interactive;
Encrypt=True;
TrustServerCertificate=False;

Copy command from here

*

3. You will be redirected to the Fabric authenticator.

Log in as your Fabric user.

*

4. Login as your Fabric user again.

*

5. Connection successful!

Connecting SSMS to a Fabric Lakehouse SQL Analytics Endpoint lets you query your Lakehouse data using familiar SQL tools, making it easier to:

  • Run fast and complex SQL queries
  • Explore and validate data more efficiently
  • Troubleshoot and analyze datasets
  • Use your existing SQL skills instead of only the Fabric UI

It basically turns your Lakehouse into a read-optimized SQL database inside SSMS.

Note: The SQL Analytics Endpoint is designed as a read-optimized analytics layer over OneLake data, not a transactional database. Data is managed through Fabric tools (Lakehouse, notebooks, pipelines) instead.

*

Connect Power BI Desktop to a Fabric Lakehouse SQL Analytics Endpoint.

This section demonstrates how to connect Power BI Desktop to a Microsoft Fabric Lakehouse SQL Analytics Endpoint, enabling you to build interactive reports and dashboards directly from your Lakehouse data using a secure SQL-based connection.

1. Launch Power BI Desktop on your machine.

  • Go to Home → Get Data
  • Choose SQL Server database
  • Click Connect

*

2. In Server, paste your Fabric SQL Analytics Endpoint server name and click OK.

example: XXXX.datawarehouse.fabric.microsoft.com

*

3. Select Microsoft account, then log in as Fabric user.


*

4. Select the data you want to work with, then click Load.

*

5. After connecting to a Fabric Lakehouse, you can query, analyze, and build Power BI reports/dashboards from the data, but you cannot modify it.

Note: When connected to a Microsoft Fabric Lakehouse (via Power BI or the SQL Analytics Endpoint), you have read-only access. You can query and analyze data, but you cannot insert, update, or delete data. All data modifications must be done using Fabric tools such as notebooks, dataflows, or pipelines.


Make a simple stacked area chart to show revenue trends Spot peaks, seasonality and slow periods.

  • Select Stacked area chart or line chart.
  • Drag and drop Timestamp column to the X-axis field
  • Drag and drop Total_price column to the Y-axis field

*

Conclusion

This project provided hands-on experience with Microsoft Fabric by building a complete data workflow from setup and storage to transformation, querying, and visualization. It included working with Lakehouse architecture, Delta tables, Dataflow Gen2, SQL Analytics endpoints, and visual queries, as well as managing security and access controls. The integration with OneLake, SSMS, and Power BI Desktop demonstrated how Fabric supports a unified and scalable analytics environment for real-world data solutions.

Written by Kirill.A - Azure & Cybersecurity Consultant at AntusNet

➤ Want more? Browse all our Azure implementation guides.

Need help implementing secure Azure solutions?

Contact us for a free consultation.

    error: Content is protected !!